Study of carbon catabolite repression in Escherichia coli by monitoring the activity of Crp-cAMP dependent promoters
Author cheating statement (2023)
This publication has never been published in the peer-review system. It is published here, on this website, more than 10 years after the writing of the manuscript. The identity of the author (or the authors) is hidden for reasons unrelated to science. In this publication, one will find description of experiments, figures, data… I have to warn the reader that I mainly cheat for all figures, data proposed here… I mean that I have performed a lot of arbitrations that would, without any doubt, be considered by most scientists as falsification of data/figure/experiment and thus as cheating. However, I always did it in order to maximise the probability that the reader succeeds to reproduce the results and, thus, thinks internally: “what this Man has claimed is actually the truth”. I repeat that the anonymisation of this publication is unrelated to this confession of cheating.
Nevertheless, I have to confess one regret in this publication. One Achilles’ heel. I never have checked the “keio collection” mutants by means of sequencing. A good practice (a better practice) would have been to do it. For most mutants in this study, it would have been useless since phenotype was, to my point of view, a sufficient proof ( crp and cyaA mutants for instance). However, and especially for the crr mutant and all strains involving the crr deletion, the results of this publication would have been a bit strengthen if I would have the proof of the correct deletion of crr visualized on sequencing data. In case of incorrect deletion that I would have missed, some conclusions of this publication may be partially or completely wrong. However, I think that the crr deletion was correct because I got an especial phenotype (1) and because I have worked with hundreds/thousands of “Keio collection” mutants and have found, by means of phenotype analysis, that the confidence that one may have in a given mutant of this collection is extremely high (2).
Viafx24
Abstract
Despite decades of intensive study, the understanding of the precise mechanism underlying carbon catabolite repression (CCR) in Escherichia coli is still far from complete. The central regulator of CCR is Crp, which becomes active in the presence of cAMP. However, addition of exogenous cAMP often fails to elicit the expected response. In this study, we have investigated some of the reasons for this unexpected result. We measured the activity of numerous CRP-cAMP dependent promoters in different conditions and genetic backgrounds. We used two different reporter genes (GFP and luciferase), measuring expression kinetics at the population level and at the single cell level. Our results indicate that the mechanism of carbon catabolite repression involves a metabolic control unrelated to the concentration of cAMP or to the phosphate transfer system.
Introduction
In microorganisms, certain carbon sources are preferred to others. For example, when the medium contains glucose and lactose, Escherichia coli preferentially uses glucose and starts to metabolize lactose only when glucose is exhausted (monod, 1942). This phenotype is explained by the inhibitory effect of glucose (the so-called glucose effect) on the expression of genes involved in lactose catabolism: the extensively studied lac operon. The phenomenon has been observed with other carbohydrates in many different prokaryotes and has been called carbon catabolite repression (CCR)(Magasanik, 1961). It refers to the general phenomenon whereby the presence of certain carbon sources in the medium represses the expression of certain genes or operons (Gorke & Stulke, 2008a).
Two complementary mechanisms have been proposed to explain the glucose mediated catabolite repression in E. coli: the "inducer exclusion model" (Saier & Roseman, 1972) and the "cAMP model" (Ullmann & Monod, 1968; Perlman et al., 1969). The uptake of glucose is mediated by the phosphopenolpyruvate:glucose phosphotransferase system (PTS). This system sequentially transfers a phosphoryl group originating from phospoenolpyruvate to glucose via several enzymes including EIIAglc (Postma et al., 1993). The cornerstone common to both models is the phosphorylation state of the enzyme EIIAglc.
In the inducer exclusion model, the dephosphorylated form of EIIAglc, the dominant form in the presence of glucose, binds and thereby inhibits different sugar transport systems, thus preventing the entry of the inducing sugar into the cell.
In the cAMP model (Kolb et al., 1993), the phosphorylated form of EIIAglc, the dominant form in the absence of glucose, binds and thereby activates adenylate cyclase, the enzyme that converts ATP into cAMP. The concentration of cAMP quickly increases, binds to Crp (cAMP receptor protein) and converts this global transcription factor to the active form, Crp-cAMP. Figure 1 summarizes these two models, taking as an example the well-studied regulation of lacZ expression.
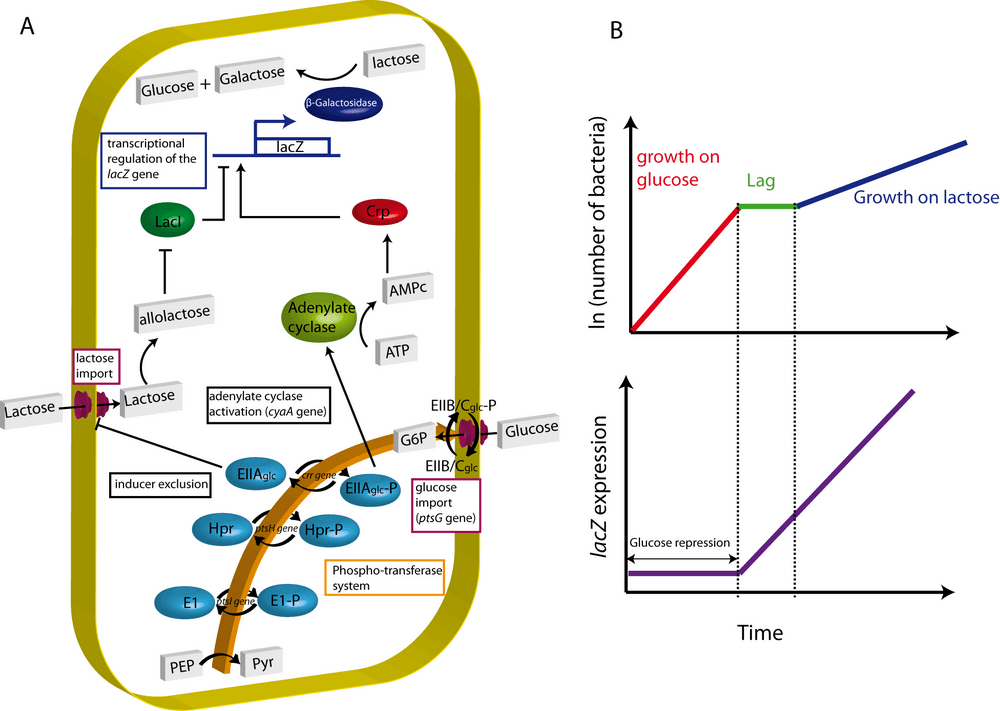
Yet, despite more than four decades of research, our understanding of the precise mechanism undelying carbon catabolite repression remains incomplete and subject to debate (Inada et al., 1996; Crasnier- Mednansky, 2008; Gorke & Stulke, 2008b; Narang, 2009a). Although the two models have a certain predictive power, each one has to struggle to account for experiments contradicting particular model predictions. For instance, glucose repression have still been observed in a crp* strain which harbors a modified Crp protein that binds to the Crp-cAMP binding site even in absence of cAMP (Inada et al., 1996; Khankal et al., 2009). Moreover, both models fail to explain why PTS-independent carbon sources, such as glucose-6-phosphate, induce a strong catabolite repression even in PTS-deficient strains (Hogema et al., 1997).
In a previous study (article not yet published), we studied the expression of acs, a gene whose transcription is strongly repressed by glucose and positively regulated by the CRP-cAMP complex (Kumari et al., 2000). We described several experiments whose results did not fit well with the current models of carbon catabolite repression. In particular, we failed to relieve glucose repression by adding exogenous cAMP to the growth medium. Here, we investigate in detail the reasons for these unexpected results. We first measured the acs promoter activity in different conditions and in different genetic backgrounds by using two different reporter genes (GFP and luciferase). We then extended our investigation to other Crp-cAMP dependent promoters. Our results show that the mechanism of carbon catabolite repression cannot be totally explained neither by low levels of intracellular cAMP, nor by the phosphorylation state of EIIAglc. We conclude that a reduction of the glycolytic flux, unrelated to the PTS or cAMP level and detected by an as yet unidentified metabolic sensor, is needed to fully induce Crp-cAMP dependent promoters.
Results
The acs promoter is strongly controlled by carbon catabolite repression
To measure acs expression, we used the previously described transcriptional fusions p-acs-lux and p-acs-gfp (article not yet published). Briefly, the acs promoter is cloned either upstream luxCDABE or gfpmut2 reporter genes on a plasmid carrying either the colE1 (p-acs-lux) or the pSC101 (p-acs-gfp) origin of replication. To measure gene expression, we grow cells on minimal medium with the indicated carbon sources for several hours within a thermostated micro plate reader with periodic agitation. We measured absorbance, luminescence and fluorescence at intervals of about 5 minutes.
In a wild-type Escherichia coli strain growing on minimal medium (M9) supplemented with 0.03% glucose and 0.03% acetate, we observe a strong induction of acs expression when growth slows dramatically (glucose exhaustion) (Figure 2A). For reasons of clarity, we will not show the growth curves in the following profiles. However, to assist readers, we generally indicate the time of glucose exhaustion by an arrow. Identical profiles are obtained using the two reporter systems and plasmids carrying two different origins of replication. In addition, we have verified the expression profile by an independent method, qRT-PCR (article not yet published). We can therefore ascertain that the signal we measure reflects transcriptional regulation of the acs gene.
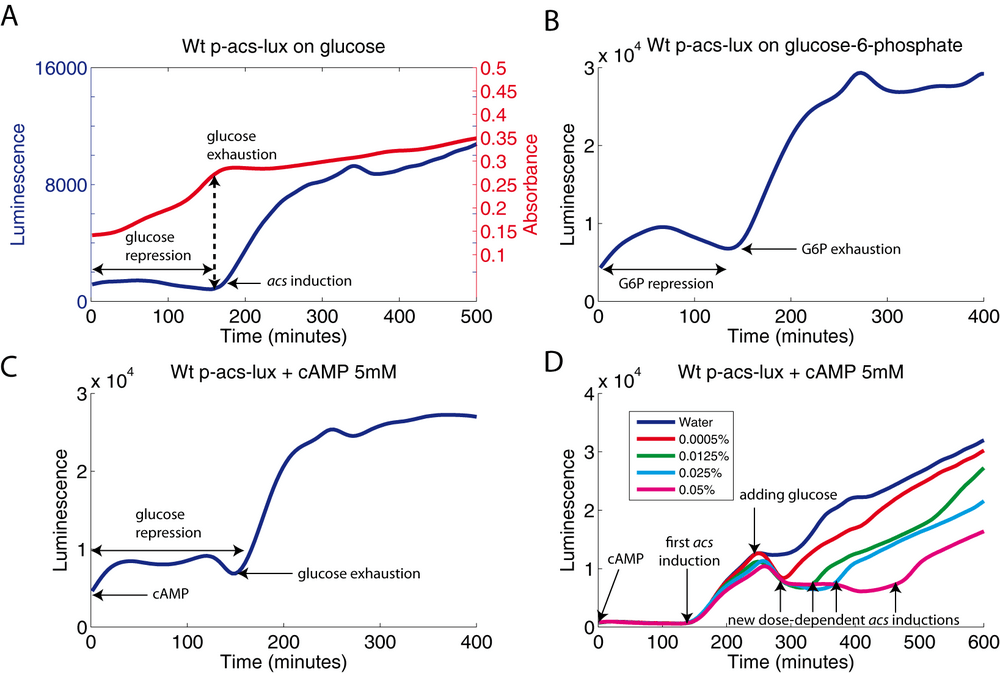
We observe an essentially identical expression profile when growing the wild-type strain on the non-PTS sugar glucose-6-phosphate (Figure 2B). This experiment demonstrates that the acs promoter is also strongly repressed by glucose-6-phosphate. Adding exogenous cAMP (5mM) at the beginning of the experiment fails to directly induce the expression of the acs gene (Figure 2C). Adding glucose to the well during the experiment after glucose exhaustion, i.e., during the induction of acs, immediately stops the acs promoter activity. A acs induction occurs again when the newly added glucose is exhausted. The more glucose was added, the longer the duration of the shutoff of acs (Figure 2D). The time it takes for the expression of acs to stop when adding glucose (well below 10 minutes) is not compatible with the transcription and translation of a new hypothetic regulator. Thus, the repression occurs at the time-scale of signal transduction, e.g., the sensing of a biochemical signal. This switching behavior triggered by glucose is independent of the variation of the cAMP concentration, since cAMP is added in excess to the medium at the beginning of the experiment.
Role of Crp-cAMP in carbon catabolite repression of the acs promoter
To clearly define the roles of Crp and cAMP in the control of acs expression, we measured the acs promoter activity in an adenylate cyclase deficient strain (cyaA mutant) and in a crp mutant. In both strains, no transcription of acs occurs, demonstrating the total dependence on the Crp-cAMP complex (controls on Figure 3A and 3B). In the cyaA strain, adding exogenous cAMP at the beginning of the kinetics restores the same acs transcription profile as the one observed in a wild-type strain (Figure 3A), showing strong acs induction only when glucose is exhausted. The lack of acs expression during growth on glucose could be due to the absence of Crp during this growth phase. To exclude this possibility, we constructed a plasmid that over-express the Crp protein when induced by anhydrotetracycline (aTc). This plasmid complements the crp mutant in a dose dependent manner (aTc), but only when glucose is exhausted (Figure 3B).
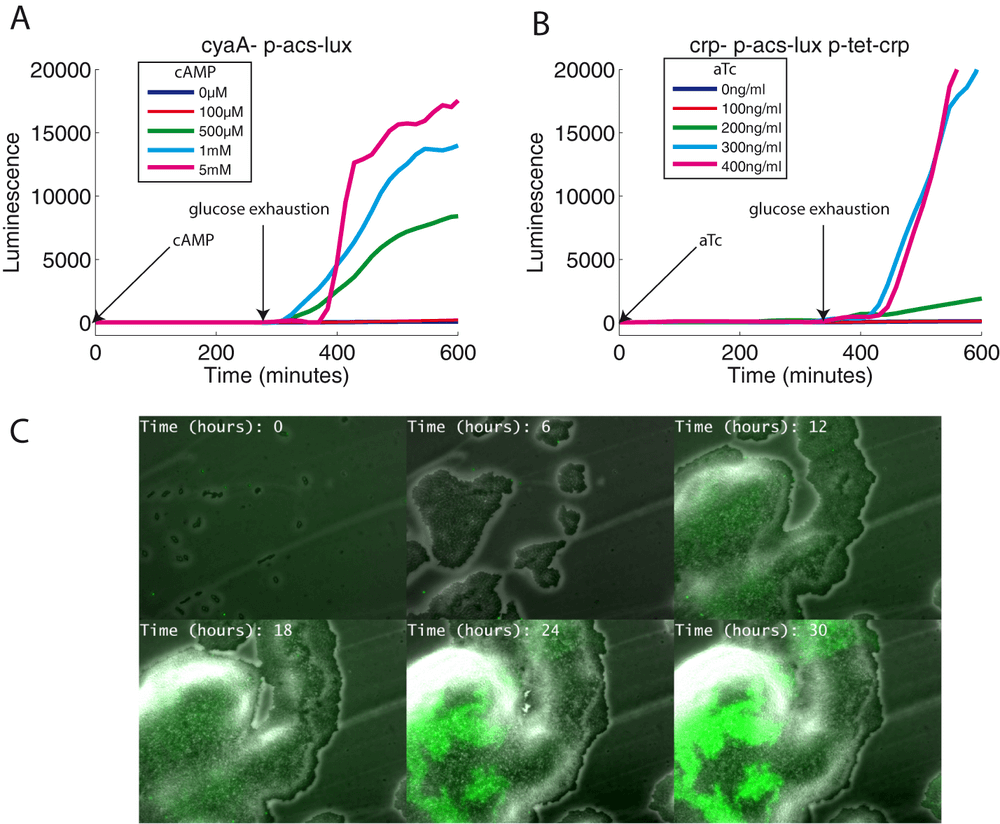
The sudden induction of acs in the wild-type strain and its absence in a cyaA strain have also been observed at the single cell level using time-lapse microscopy. We grew these two strains (transformed with the p-acs-gfp plasmid) together on a solid and translucent medium and acquired fluorescence and phase contrast images for several hours. As expected, only part of the bacterial layer (corresponding to the wild-type strain) showed a sudden increase of fluorescence once the micro colony has stopped growing (Figure 3C; supplementary movie 1). Furthermore, in this experiment, the growth conditions (oxygenation, growth rate, contact with neighboring bacteria) are quite different from the conditions of growth in a homogeneous, liquid culture. Yet, the observed expression profile is remarkably resilent.
Role of the PTS in carbon catabolite repression of the acs promoter
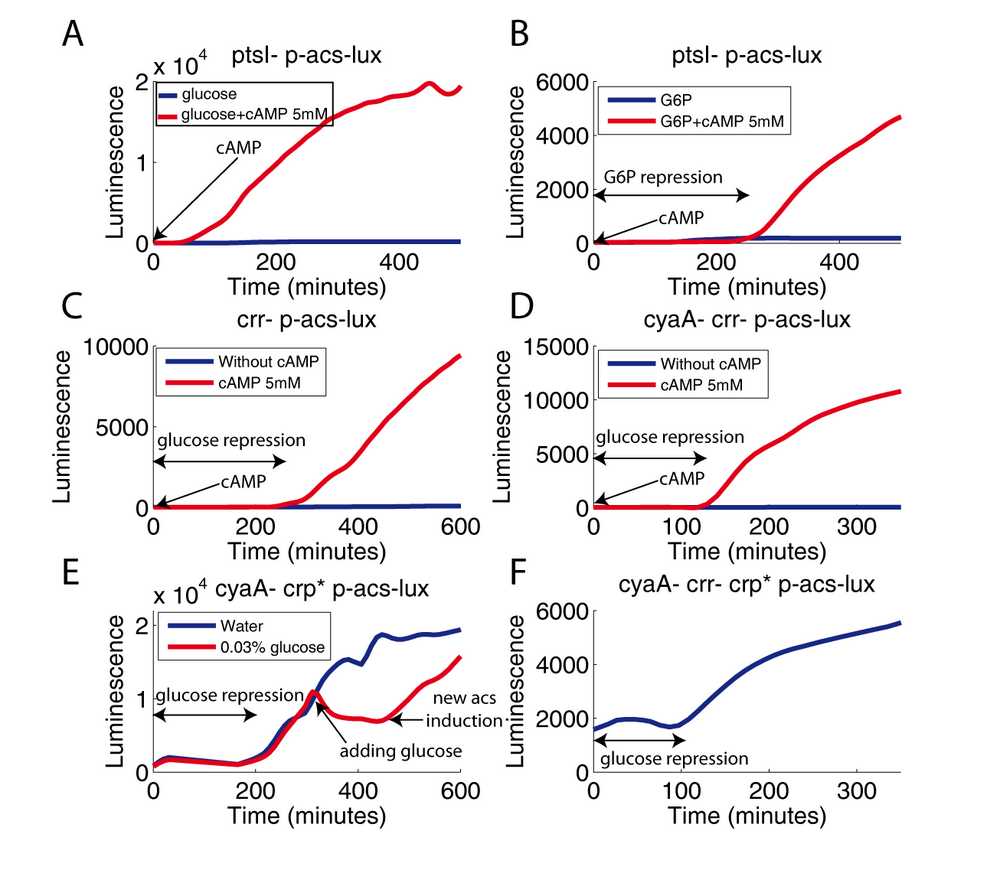
To assess the role of the PTS in glucose-mediated repression of the acs promoter, we had previously measured its activity in two PTS mutants: the ptsI and crr strains. The E1 deficient strain (ptsI mutant) has a much lower growth rate on glucose. Since this mutant completely inactivates the PTS by blocking the first step of phosphate transfer, glucose has to enter the cell via PTS-independent transporters (MglC and GalP) (Gosset, 2005). acs expression in this strain is very weak, suggesting the role of the PTS in the production of cAMP. Adding exogenous cAMP restores acs transcription, even in presence of glucose (Figure 4A).
Restoring a fast growth rate by providing the favorable, non-PTS sugar glucose-6-phosphate re-established the repression of acs transcription in presence of exogenous cAMP (Figure 4B). First, this experiment shows that glucose-6-phosphate maintains a strong repression of the acs promoter, even in a PTS-deficient strain. Therefore, the repression of the acs promoter cannot be due to a modification of the PTS phosphorylation state by glucose-6-phosphate. Second, the major difference between growth on glucose and growth on glucose-6-phosphate in a ptsI mutant, and in the presence of exogenous cAMP, is the growth rate. The ptsI strain has a strong growth defect on glucose whereas it grows normally on glucose-6-phospate which is transported by a PTS independent hexose-phosphate system. Once in the cell, both substrates are metabolized by glycolysis. The acs promoter thus seems to somehow sense the rate of glucose metabolism and is activated when glycolysis is slow.
We also measured acs expression in an EIIAglc deficient strain (crr mutant), i.e. a strain that lacks the component of the PTS at the crossroad between inducer exclusion and activation of adenylate cyclase. The crr mutant grows at an almost normal rate on glucose, i.e., much faster than the ptsI strain. Since there are several alternative EIIA proteins that can participate in the PTS, the absence of EIIAglc may probably be compensated by another EIIA protein. The acs promoter activity in this strain is very weak (Figure 4C). Exactly as observed with the cyaA mutant, exogenous cAMP restores acs expression with a profile very similar to the wild-type pattern. These observations suggests that EIIAglc is important for stimulating adenylate cyclase when glucose is absent from the growth medium. However, this experiment also points out an important shortcoming of current models of CCR: the simultaneous absence of a EIIAglc mediated hypothetical (acetate has never been described as an inducer of acs expression) inducer exclusion and the presence of exogenous cAMP are not sufficient to remove glucose repression. This result is further confirmed in the crr cyaA double mutant (Figure 4D). Glucose repression is clearly maintained until all glucose is exhausted. Thus, deleting the two main components of carbon catabolite repression has failed to remove the glucose mediated acs repression. Neither the "cAMP model" nor the "inducer exclusion model" are able to explain this result. Potential explanations involving a major role of Fis, IHF, IclR, FNR, RpoS, FruR or Mlc were discarded by using the corresponding mutants (data not shown).
Role of cAMP import/export in carbon catabolite repression of the acs promoter
One possible explanation of the previous results is that glucose controls the import/export of cAMP and thus prevents the entrance of exogenous cAMP (Buettner et al., 1973). Indeed, the mechanism of import/export of cAMP remains largely unexplained, even though recent results suggest that TolC is partly responsible for the active export of cAMP (Hantke et al., 2011). To assess a possible control of cAMP import/export as an explanation of our results, we constructed a cyaA crp* strain harboring a modified Crp* protein carrying three amino acid substitutions (I112L, T127I, and A144T) (Khankal et al., 2009). This Crp* protein binds to the Crp-cAMP DNA binding site even in the absence of cAMP. We confirm that the three amino acid difference between the cyaA mutant and the cyaA crp* strain is sufficient to restore acs transcription without the need of adding exogenous cAMP to the medium. However, again, induction of the acs promoter occurs only after glucose exhaustion. Furthermore, adding glucose just after the first acs induction immediately stops acs promoter activity. A new induction occurs when the newly added glucose is exhausted (Figure 4E). This experiment excludes the possibility that the control of cAMP export or import be responsible for the glucose repression. We obtained similar results using a crr cyaA crp* triple mutant (Figure 4F). In other words, we observe a strong glucose repression in a strain without cAMP nor EIIAglc.
Carbon catabolite repression of other Crp-cAMP dependent promoters
Are our results a particular quirk of the acs promoter or a general characteristic of CCR? In order to answer this question, we studied the expression dynamics of five other Crp-cAMP dependent genes: araBAD, glpA, sdhC, gntT, uhpT. All corresponding transcriptional fusions to gfp (Zaslaver et al., 2006) are clearly sensitive to exogenous cAMP. With the exception of sdh, these promoters also need inducers to be activated: arabinose (araBAD), glycerol (glpA), glucose-6-phosphate (uhpT) and gluconate (gntT) were therefore added as needed.
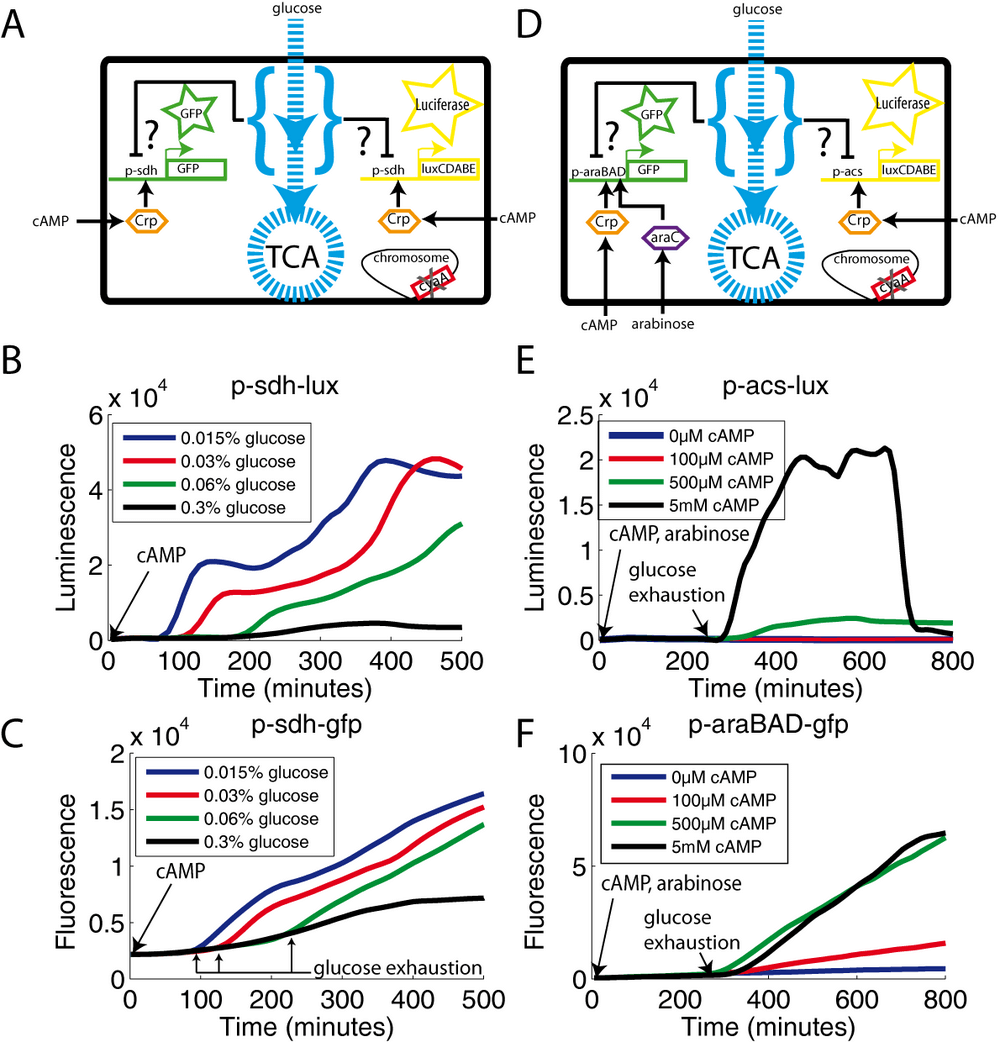
For the sdh promoter, we also constructed the corresponding transcriptional fusion to the luciferase operon. To minimize the probability of any artifact due to the plasmids or reporter systems, we transformed the cyaA mutant with both plasmids (p-sdh-lux and p-sdh-gfp) in order to simultaneously monitor luminescence and fluorescence signals (Figure 5A). Figures 5B and 5C confirm that the expression profile is independent of the reporter system, even though GFP is somewhat less reactive than luciferase. This is expected, since GFP has to maturated the fluorophore before emitting a signal, whereas luciferase is active as soon as the protein is synthesized. In this experiment, we added 500μM cAMP to the medium at the beginning of the experiment. As observed with the acs promoter, the sdh promoter is fully activated only after glucose exhaustion. Increasing concentrations of glucose extend the duration of the growth phase and correspondingly glucose repression (Figure 5B and 5C).
We also used the double reporter technique to simultaneously monitor the activity of two different promoters (araBAD) and (acs) in the same cell (Figure 5D). In this experiment, we grew the cyaA mutant on glucose and acetate (the carbon sources), in the presence of arabinose and cAMP (the inducers). Both luminescence (acs) and fluorescence (araBAD) strongly increase after glucose exhaustion (Figures 5E and 5F). As expected, the promoter strength after glucose exhaustion is a function of the cAMP concentration, araBAD reaching maximal activity at a lower cAMP concentration than acs. Thus, the sdh and araBAD promoters behave as the acs promoter: full induction occurs only after glucose exhaustion, even when cAMP is present in the medium. The same holds true for the glpA promoter (see supplementary information). The behavior of the acs promoter is therefore representative of several CCR-controlled promoters. Furthermore, for these promoters, the induction behavior mirrors the one of acs also in the "cAMP and EIIAglc free" strain (cyaA crr crp*) (supplementary information). However, we failed to observe glucose repression for the uhpT and gntT promoters even though the strength of their promoter activity was easily controlled by ranging cAMP (see discussion and supplementary information).
Role of the glycolytic flux
The experiments shown in figure 4 show that neither the functioning of the PTS nor the variation of cAMP concentration explain carbon catabolite repression. The major, systematic difference between situations where the acs promoter is induced or not is the growth rate, and more specifically the glycolytic flux (the rate of glycolysis, going from glucose-6-phosphate to pyruvate). For example, glucose and glucose-6-phosphate, after having entered the cell are both in the form of glucose-6-phosphate. The difference in our experiments is the rate of import of these molecules in different situations and mutant backgrounds. In agreement with this hypothesis, we had previously observed, that acs expression in a ptsG strain (deleted for the main glucose transporter) was clearly upregulated compared to the wild-type strain during growth on glucose (article not yet published). The ptsG strain is able to grow on glucose by using other transporters, but its growth rate, and thus its glycolytic flux, is strongly reduced.
We therefore set out to verify a prediction of this hypothesis: we should be able to control carbon catabolite repression by modifying the glycolytic flux. This can be done by supplementing the growth medium with a non metabolizable analogue of glucose, α-methyl glucose. We could indeed induce several Crp-cAMP operons by adding the appropriate concentration of α-methyl glucose into the growth medium. An example is shown in figure 6A, where we control the activity of the sdh promoter in a cyaA mutant (supplemented with exogenous cAMP) by increasing the concentration of α-methyl glucose. Thus, we do not observe catabolite repression induced by non metabolizable sugars (Ambrose & MacPhee, 1998).
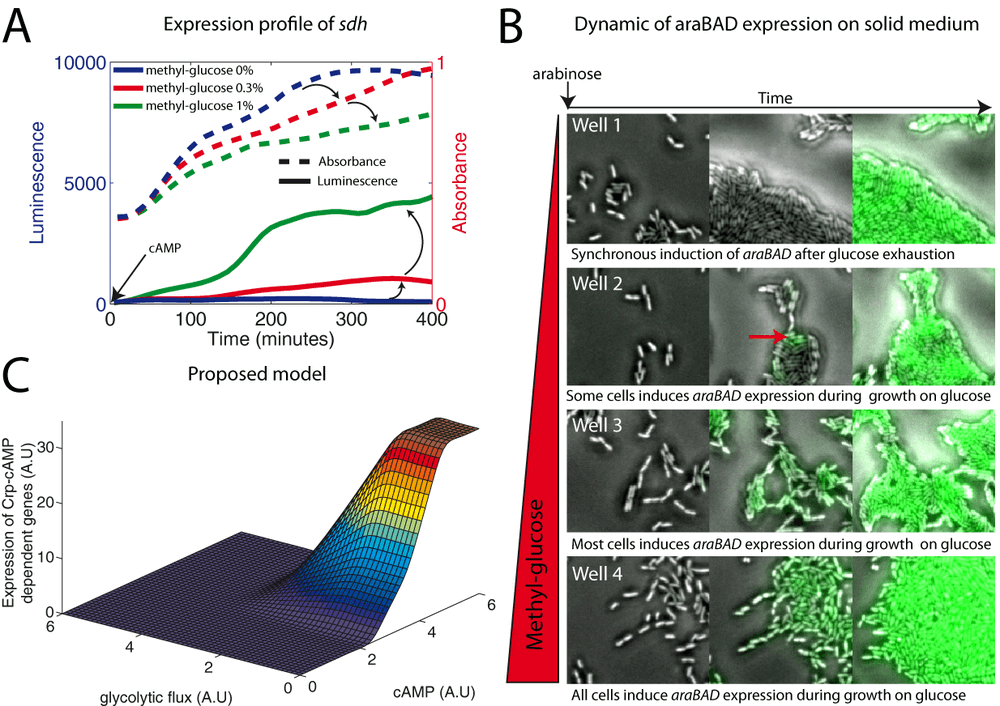
We performed a similar experiment at the single cell level. We filmed 4 different wells in parallel (6-wells microplate). Each well contains a solid medium (M9 agarose with glucose and arabinose). The parameter that varies between these 4 wells is the concentration of α-methyl glucose. Figure 6B shows the difference of araBAD expression between those wells (supplementary movie 3). In well 1, there is no α-methyl glucose: cells grow fast while there is glucose and when this latter is exhausted, they induce synchronously the expression of araBAD. In well 2, the α-methyl glucose has slightly reduced the glycolytic flux and some cells induce the araBAD expression before glucose exhaustion. In well 3, the glycolytic flux is strongly reduced, growth is slow and most cells induce the araBAD expression before glucose exhaustion. In the last well, the concentration of α-methyl glucose is so high that cells appear to be poisoned, but all induce araBAD expression before glucose exhaustion. This experiment demonstrates that we can control carbon catabolite repression by tuning the glycolytic flux. The heterogeneity of araBAD expression between the cells is a well-known phenomenon (Megerle et al., 2008). This experiment also points out a way to tune the distribution of araBAD expression in the population of cells.
Discussion
In this study, we have explored the mechanism of carbon catabolite repression by studying the regulation of transcription of Crp-cAMP dependent operons in different genetic contexts and in different conditions. We monitored in vivo, in real time and with a high temporal resolution, the activity of several Crp-cAMP dependent promoters. Different strategies of controls have been implemented to assess the robustness of our results: we used two reporters systems (GFP/luciferase) and we performed the experiments both at the population level (liquid medium) and at the single cell level (solid medium).
Is there any role for cAMP in carbon catabolite repression of the Escherichia coli Crp-cAMP operons?
This question has been addressed in 2008 for the case of the lac operon (Gorke & Stulke, 2008b; Crasnier-Mednansky, 2008; Narang, 2009a). In 1998, Inada et al. have demonstrated than glucose repression is maintained both in a cyaA strain complemented with cAMP and in the double mutant cyaA crp* (Inada et al., 1996). The authors concluded that inducer exclusion, blocking the entry of lactose, was the main contributor to carbon catabolite repression when E. coli grows in the presence of both glucose and lactose. Later, Narang (Narang, 2009b), by an accurate and exhaustive review of four decades of results, has pointed out that the small difference of levels of cAMP during growth on glucose compared to growth on lactose cannot account for the large repression of β-galactosidase on glucose. These results clearly challenge the cAMP model.
In this context, our results demonstrate: (i) that cAMP is necessary in the wild-type strain to increase transcription of Crp-cAMP dependent promoters. Adding cAMP in the medium complements the cyaA mutant and thus increases the expression of all operons studied in this work ; (ii) that, in the wild-type strain, cAMP is not sufficient for explaining carbon catabolite repression: adding cAMP to the medium fails to retrieve full gene expression while glucose is still present ; (iii) that cAMP is not necessary in a cyaA crr crp* strain. This strain, devoid of all supposedly essential components of CCR, still shows strong glucose repression.
Is there a role for the PTS in carbon catabolite repression of the Escherichia coli Crp-cAMP operons?
Dephosphorylation of enzyme IIAglc is thought to be the main cause of glucose repression. However, non-PTS carbohydrates, such as glucose-6-phosphate, also induce a strong catabolite repression. Hogema et al. have shown that glucose-6-phosphate added in the medium induces the dephosphorylation of EIIAglc. Yet, they have also observed that glucose-6-phosphate is still able to repress catabolic operons in a crr strain (Hogema et al., 1997). This last result clearly challenges the main role of enzyme EIIAglc in carbon catabolite repression.
In this context, our results: (i) demonstrate that, in the wild-type strain, the PTS is necessary for increasing transcription of the acs promoter: the ptsI and crr strains show a very low level of acs transcription, except when exogenous cAMP is added to the medium ; (ii) demonstrate that the PTS is involved in the control of cAMP production: the activation of adenylate cyclase by the EIIAglc enzyme remains poorly understood as it seems to require additional components not yet discovered (Park et al.,2006); (iii) demonstrate that the phosphate transfer system (PTS) is not sufficient to account for carbon catabolite repression: a strong carbon catabolite repression still occurs in a crr strain complemented with exogenous cAMP ; (iv) demonstrate that the PTS is not necessary in a crr cyaA crp* strain for carbon catabolite repression: this strain still shows glucose repression.
Mechanism of carbon catabolite repression
How can we reconcile these apparently contradictory results? The rise of the intracellular concentration of cAMP when glucose is exhausted is correlated with the induction of Crp-cAMP dependent operons. The simplest and most intuitive explanation is that this increase in cAMP concentration is responsible for the induction of Crp-cAMP dependent operons (Epstein et al., 1975). However, there still remains the counter-intuitive possibility that those events, although correlated, may not be linked by a cause and effect relationship. Our experiments show that the sequence "glucose exhaustion - rise in cAMP concentration - transcription of Crp-cAMP operons" is not correct, or at least incomplete. The model that we propose in figure 6C assumes that the transcription of CCR-controlled Crp-cAMP operons requires two factors: a sufficient concentration of cAMP and a reduction of the glycolytic flux.
The glycolytic flux would have to be detected by an as yet unknown sensor, detecting the concentration of an as yet unidentified metabolite. Different CCR-controlled promoters differ by their sensitivity to this signal and their sensitivity to the concentration of cAMP. Only when both conditions are met will the corresponding promoter be fully induced. The acs promoter, for example, requires a high concentration of cAMP, whereas the uhpT promoter is already induced at a much lower concentration. Therefore, in the presence of glucose-6-phosphate, growth rate and glycolytic flux are high, and the cAMP concentration is low. With a qualitatively identical regulation mechanism (Figure 6C), but different parameters, the acs promoter is turned off in these conditions, whereas the uhpT promoter is fully active. When glucose-6-phosphate is exhausted, growth rate decreases and the concentration of cAMP increases. Acs is now fully expressed. According to the model, uhpT should still be maximally expressed. However, this promoter also requires the inducer glucose-6-phosphate for full activity, and this inducer is no longer present. UhpT transcription is thus shut off (see supplementary information: the metabolic toggle switch). Even though the underlying regulatory mechanism is the same for both promoters, the observed expression pattern is very different. The same is true for the gntT promoter, responding to gluconate. This dual antagonistic effect of inducers has previously been described in a study that also clearly points out problems with the cAMP model (Peekhaus & Conway, 1998).
A unifying view of carbon catabolite repression
We therefore propose that carbon catabolite repression comprises the "classical" mechanisms involving the PTS and the concentration of cAMP. In addition, a yet unknown sensor detects the "metabolic state" of the cell, closely related to the glycolytic flux. The unknown mechanism (i) is independent of the concentration of cAMP, the phosphorylation state of EIIAglc and the concentration of Crp; (ii) is correlated with the glycolytic flux, but unrelated to PTS functioning, and thus unrelated to the PEP/pyruvate ratio (Hogema et al., 1998); (iii) functions as a rapid switch, at the scale of signal transduction events. The activity of the CCR-controlled promoters results then from the synergistic activation of the target promoter by these two signals. We are currently working on the identification of this unknown signal and the way this signal is ultimately transmitted to the activator, Crp.
Materials and Methods
Strains
The mutant strains come from the Keio collection (Baba et al., 2006). The wild-type strain (E. coli K-12 strain BW25113) has a well-defined pedigree and has not been subjected to mutagens (Datsenko & Wanner, 2000). This wild-type strain contains a deletion of the araBAD operon. Consequently, arabinose, that we add as inducer, can't be used as a carbon source and thus its concentration remains constant. We removed several kanamycin cassettes from mutants using flp recombinase to allow antibiotics compatibility with the plasmids derived from the Zaslaver collection. The cyaA crr double mutant was constructed by removing the kanamycin resistance cassette of the cyaA strain. Then we transduced (P1 phage transduction) the kanamycin resistance cassette of the crr strain in the cyaA strain and then remove again the new kanamycin cassette. The crp* strain comes from a gift of Pr. Patrick Cirino (Khankal et al., 2009). The crp* gene was introduced into the cyaA mutant and the cyaA crr double mutant by P1 phage transduction using a tetracycline resistance cassette.
Plasmids
We have used home-made p-acs-lux, p-acs-gfp and p-sdh-lux plasmids whose construction has already been described. We have also used the p-uhpT-gfp, p-araBAD-gfp, p-sdh-gfp, p-gntT-gfp, p-glpA-gfp coming from the Zaslaver collection (Zaslaver et al., 2006). Note that luxCDABE genes come from Xenorhabdus luminescens and the gfp variant used (gfpmut2) is highly stable and non toxic. The plasmid carries either a colE1 replication origin and an ampicillin resistance cassette (lux) or a pSC101 origin and a kanamycin resistance cassette (gfp). The two types of plasmid are fully compatible and they include a strong ribosome binding site just upstream the reporter gene.
The crp gene was amplified by PCR using primers 5'-ATAAGGTACCATGGTGCTTGGCAAACCGC-3'(kpnI site underlined) and 5'-TCCGGGATCCTTAACGAGTGCCGTAAAC-3'(bamH1 site underlined) using BW25113 strain as template. The PCR product, digested with kpn1 and bamH1, was inserted into the previously described p-tet-lux plasmid to make p-tet-crp.
Measurement of gene expression at the population level
Dynamic measures of gene expression were performed by growing cells in a minimal medium (M9) with the indicated carbon sources during several hours within a microplate reader (fusion alpha FP-HT). This micro plate reader allows growth with shaking and temperature control (37°C). It measure cell density (OD at 600nm), luminescence and fluorescence (485nm/520nm) at a high temporal resolution (~5 minutes). The microplate contains 180μl of medium and 20μl (dilution 10) of cells in stationary phase (pre-culture LB+corresponding antibiotics). The main parameters that differ between experiments are the cAMP, inducers, anhydrotetracycline (aTc), glucose and acetate concentrations (indicated in the legend of figures).
Measurement of gene expression at the single cell level
Briefly (details of each experiment are provided in the supplementary section), we add 1 ml of a minimal medium M9 agarose 0.8% (w/v) (with the indicated concentration of carbon sources, inducers, cAMP and antibiotics) into a 6 wells micro plate. After polymerization of agarose, the previous medium becomes solid and we add over the indicated volume of liquid M9 containing cells in stationary or exponential phase (pre-culture LB + antibiotics). We let some cells fall on the solid medium during 10 minutes and then remove this liquid medium. Cells, which are placed on the top of the agar pad, get a perfect access to oxygen and begin to form micro-colonies. Image acquisition is performed using a 40X objective of the Olympus IX81 motorized inverted microscope. Note that the solid medium is placed between the objective (down) and the cells (up). Fluorescence and phase contrast images are collected each ten minutes during several hours at room temperature. Image processing is limited to the superposition of phase contrast and fluorescence images and to the normalization between minimum and maximum pixel intensity of the images. We have used home-made scripts and the image processing toolbox of Matlab.
Supplementary information
Video 1: Wt p-acs-gfp vs cyaA- p-acs-gfp
Materials and methods
We added 1 ml of a minimal medium M9, containing 0.8% (w/v) agarose, 0.3% glucose, and 50μg/ml kanamycin into a well of a 6 wells-microplate. After polymerization of the agarose, we overlaid the now solid medium with 400μl of M9 medium and a mixture of two bacterial strains precultured in LB: 200μl of the wild-type strain containing the p-acs-gfp plasmid and 200μl of the cyaA- strain containing the p-acs-gfp plasmid. The precultured cells were still in exponential phase (OD>0.5) and their growth medium, LB, was thus still "fresh". Part of the cells sedimented onto the solid medium during a 10 minute incubation. We then removed the liquid medium. Note that the remaining traces of fresh LB medium may "help" the growth. The remaining cells are thus located on the top of the agar pad; they get a perfect access to oxygen and begin to form microcolonies. Image acquisition was performed using 40X objective of the Olympus IX81 motorized inverted microscope. The solid medium is located between the objective (down) and the cells (up). Fluorescence and phase contrast images were collected every ten minutes for several hours at room temperature. Image processing was limited to the superposition of phase contrast and fluorescence images and to the normalization between minimum and maximum pixel intensity of the entire batch of images. All image treatments were done with home-made scripts and the image processing toolbox of Matlab.
Results
Towards the end of the video we observe a strong increase of fluorescence in parts of the microcolony, corresponding to the induction of acs transcription. The time of fluorescence increase coincides with the growth arrest of the microcolony, probably due to glucose exhaustion. Other parts of the microcolony, corresponding to the cyaA- strain, remain dark (no fluorescence increase), as expected. In this video, we also observed six cells that were fluorescent already at the beginning of the experiment. Our interpretation of this observation is that these cells have a strongly reduced glycolytic flux (probably due to an unfavorable local environment, spontaneaous mutations, the particular history of these cells, or a bet-hedging strategy of the cell), and consequently express acs.
The glpA promoter
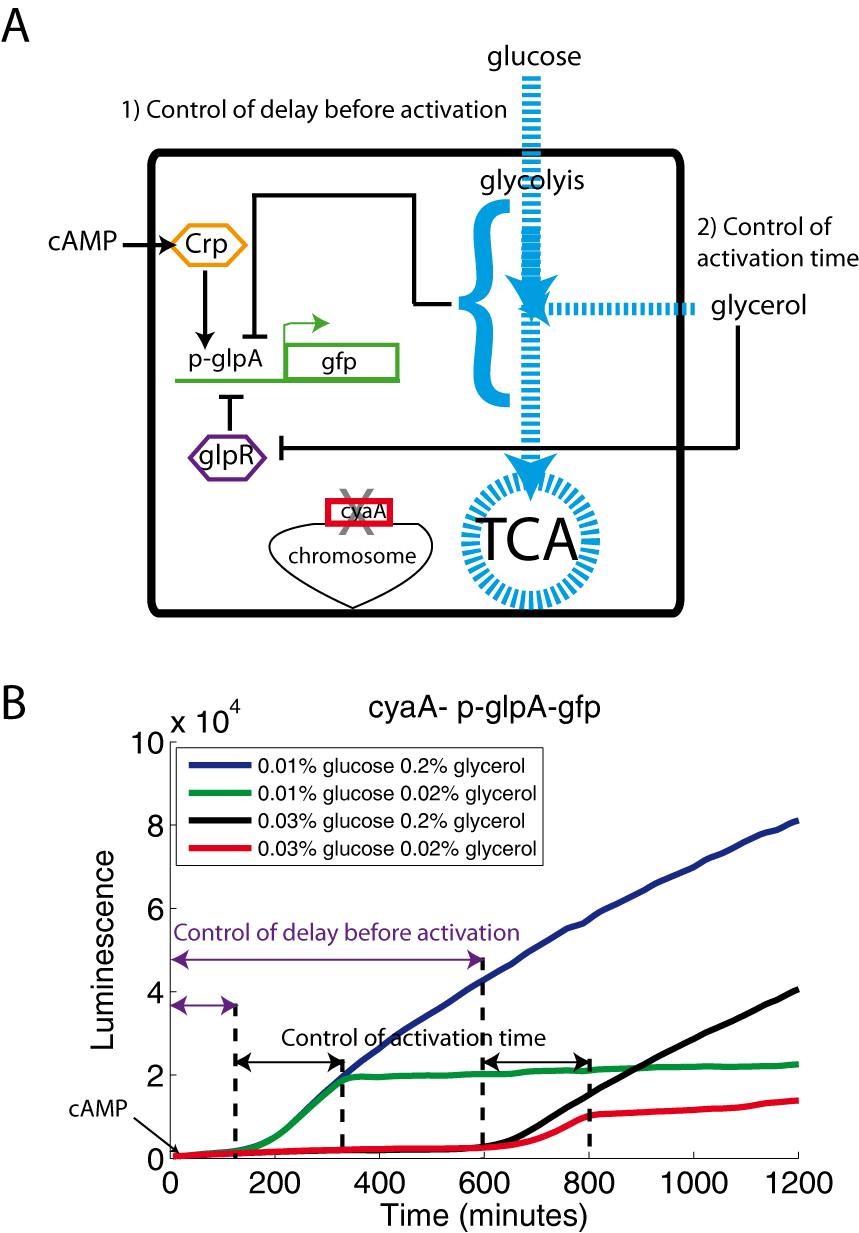
Materials and methods
A cyaA- strain transformed with the p-glpA-gfp plasmid (A) was grown in M9 medium containing glucose, glycerol and cAMP (500μM) (B). In this experiment, we have centrifuged the LB pre-culture and replaced the LB by an equivalent volume of fresh M9 before the 10-fold dilution of the cells.
Results
This promoter behaves as the acs, sdh and araBAD promoters. Glycerol and cAMP, added from the beginning of the kinetics, are not sufficient to induce the expression of glpA while glucose is still present. This behavior may be interesting for synthetic biology: glucose represses the activity of the glpA promoter and thus allows controlling the delay before the activation. Once glucose is exhausted, glycerol activates the promoter by inactivating the GlpR repressor: we observe gene expression. When glycerol is also exhausted, the activity of the glpA promoter drops again to zero.
Carbon catabolite repression in the cyaA crr crp* strain
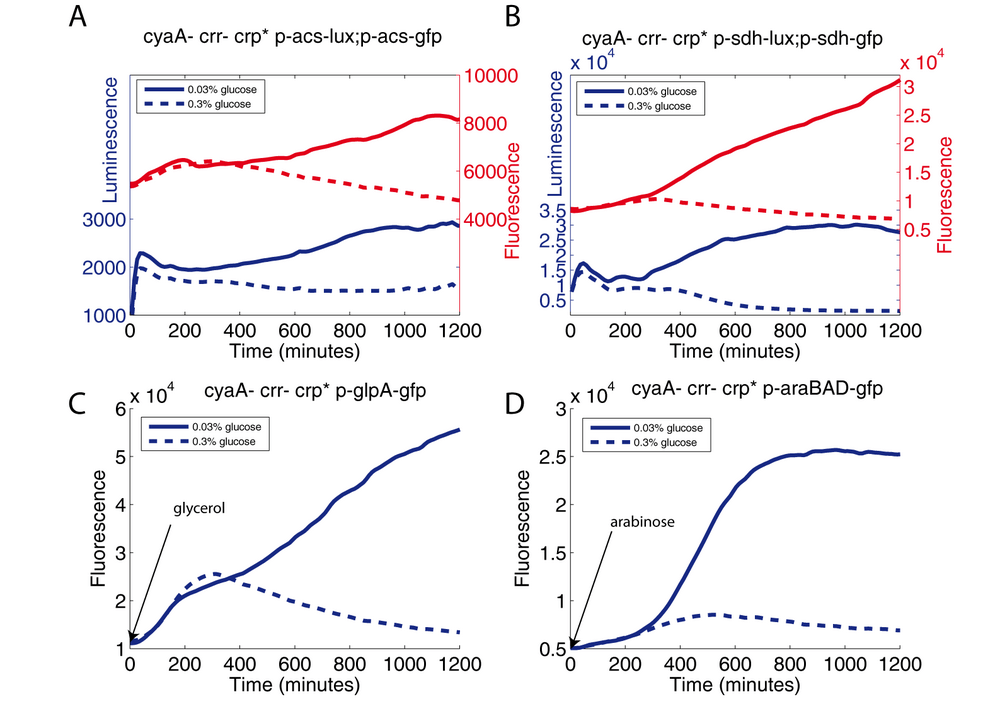
Materials and methods
The cyaA crr crp* strain, transformed with the indicated plasmids (transcriptional fusions), were grown (10-fold dilution of the preculture) either in an LB medium supplemented with 0.03% glucose or in a LB medium supplemented with 0.3% glucose. Inducers were added when needed: Glycerol (0.08%) or arabinose (0.001%).
Results
In this experiment, we measure the activity of 4 Crp-cAMP dependent promoters (acs, sdh, glpA, and araBAD) in the "cAMP and EIIAglc free" strain (cyaA crr crp*). We compare the level of fluorescence of theses strains growing in LB either with a low glucose concentration or a high glucose concentration. In all cases (A, B, C and D) we observe that the level of fluorescence (or luminescence) increases in the low glucose condition compared to the high glucose condition.
A synthetic toggle switch controlled by the glycolytic flux
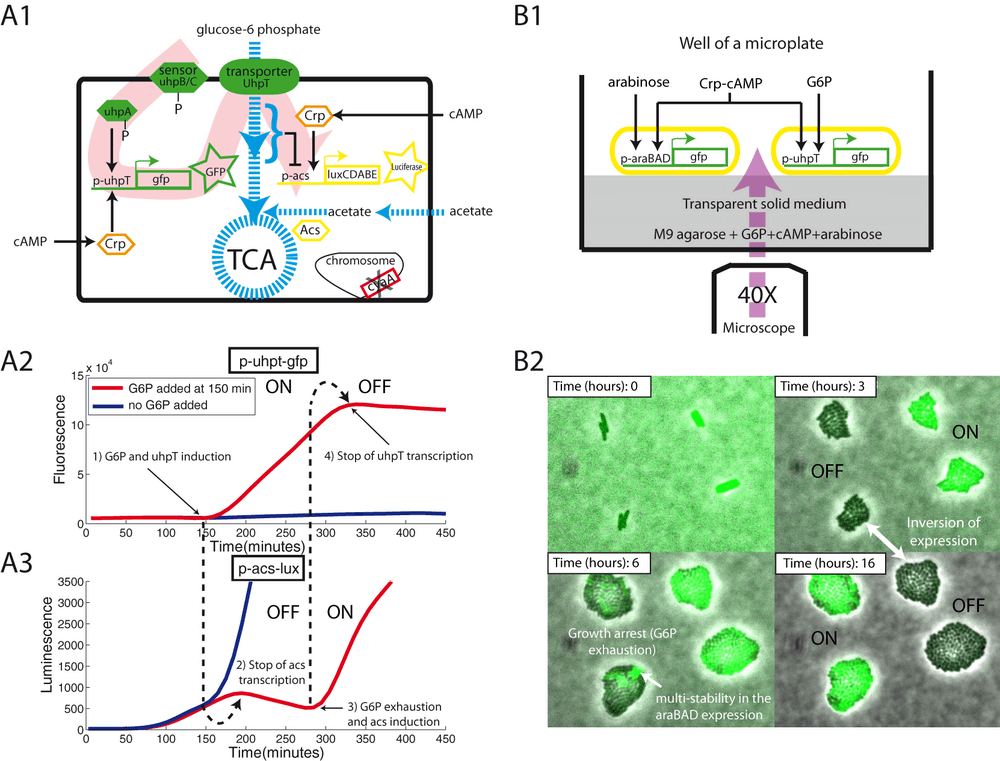
Description of the figure
(A1) Schematic of a cyaA mutant transformed with two transcriptional fusions: p-acs-lux and p-uhpT-gfp. (A2 and A3) Bacteria were grown on a minimal medium supplemented with 0.03% glucose and 0.03% acetate. At 100 minutes, we observed the first acs induction. Adding G6P (0.03%) to the medium triggers uhpT expression, leading to a strong glycolytic flux that stops acs expression. Once exhausted, G6P cannot longer activate uhpT transcription and a new phase of acs induction begins. (B1) Schematic of a well containing a solid minimal medium containing the following carbon sources and complements: G6P (0.06%), cAMP (750μM), arabinose (0.01%), and acetate (0.03%). Two types of cyaA cells monitor either (i) the expression of araBAD or (ii) the expression of uhpT. (B2) Frames of the time lapse microscopy: the two microcolonies on the left report araBAD expression whereas those on the right report uhpT expression. Note the inversion of expression after growth arrest (presence/absence of the glycolytic flux). Note also the heterogeneity of fluorescence among cells reporting the araBAD expression. This phenomenon of multi-stability is well-known : it is due to a positive feedback loop involving the arabinose transporter.
Results
Our experiments suggest that CCR-controlled promoters are activated as a function of a metabolic parameter related to growth rate, e.g., the glycolytic flux. The different CCR-controlled promoters differ by their cofactor requirements (inducers such as arabinose or glucose-6-phosphate) and their sensitivity to cAMP. At the two extremes are the acs and uhpT promoters. To visualize the complementary behavior of these two promoters, we have constructed a synthetic toggle switch.
Both promoters are dependent on Crp-cAMP, but to different extents. Whereas acs requires a high concentration of cAMP for maximal activity, uhpT already reaches maximal activity at a much lower concentration of cAMP, but in the presence of the inducer, glucose-6-phosphate. The acs promoter is repressed by glucose-6-phosphate, an excellent carbon source allowing fast growth of E. coli, whereas this compound is the indispensable inducer of the uhpT promoter. In our system (figure A1), two transciptional fusions (p-acs-lux and p-uhpT-gfp) monitor the activity of their respective promoters in a cyaA strain. As before, this strain induces acs expresssion when glucose is exhausted (luminescence; figure A3). The uhpT promoter remains inactive because the inducer is absent. We then added glucose-6-phosphate during the induction phase of the acs promoter, resulting in the activation of the uhpT promoter (increase of fluorescence; figure A2). At the same time, glucose-6-phosphate now serves as an excellent carbon source, increasing the glycolytic flux and shutting down the acs promoter. Once glucose-6-phosphate is exhausted, acs transcription is again induced and uhpT transcription is stopped. The control experiment, without addition of glucose-6-phosphate, shows no transcription of uhpT and no arrest of acs transcription, as expected.
A similar switch can be observed at the single-cell level (figure B1; supplementary movie 2). We filmed two types of cyaA cells growing on the same agar patch, using glucose-6-phosphate as a carbon source: the first cell type reported the araBAD expression (p-araBAD-gfp) that occurs after glucose-6-phosphate exhaustion, whereas the second cell type reported uhpT expression (p-uhpT-gfp) that is induced in the presence of glucose-6-phosphate. All inducers are present from the beginning of the experiment (cAMP, glucose-6-phosphate and arabinose). In figure B2, we show the inversion of expression of GFP as glucose-6-phosphate is being consumed. Cells reporting uhpT expression (on the right) are induced during the growth phase, whereas cells reporting araBAD expression are induced after exhaustion of glucose-6-phosphate.
Materials and methods
This experiment used the same protocol as that used for Video 1, with the following experimental conditions. The medium used was M9 agarose 0.8%, sodium acetate 0.03%, glucose-6-phosphate 0.06%, cAMP 750μM, arabinose 0.01%, and kanamycin 50μg/ml. We used cyaA- strains either with the p-araBAD-gfp plasmid or the p-uhpT-gfp plasmid. After polymerization of the agarose, we add over 1 ml of M9 and 20μl (dilution 50-fold) of each strain, pre-cultured in LB (stationary phase). After having removed the liquid medium, the micro-plate was placed at 37°C for 30 minutes before beginning of the image acquisition (this step facilitates automatic detection of the focus). The fluorescence intensity was not normalized between minimum and maximum pixel intensity of the entire batch of images, but for each image independently. This allows a simpler comparison of the level of fluorescence of the two strains. However, the resulting pictures suggest that GFP is degraded during the experiment, which is not the case. [2023: For a reader that don’t understand the consequence of the two lines above, this kind of image analysis should be considered as a kind of advertising. Indeed, the inversion of fluorescence of the microcolonies that shows the movie “falsely promotes” the toggle switch due to the way the normalization of fluorescence of the images has been performed. With a more classical way to normalize fluorescence data, the movie would have appeared less “sexy” due to the stability of the green fluorescent protein. This comment doesn’t change the fact that the underlying toggle switch is perfectly working and thus, perfectly efficient and “true”.
Video 3: glycolytic flux and catabolite repression
Materials and methods
We used the same method as the one of Video 1 with the following modifications. The medium used is M9 agarose 0.8%, glucose 0.06%, and arabinose 0.005%. We used a sucB mutant transformed with the p-araBAD-gfp plasmid. This strain is used because it can not grow on the secreted acetate. This leads to a very sudden growth arrest when glucose is exhausted (see the video). In this experiment, we filmed four wells in parallel. The only difference between the wells is the concentration of α-methyl-glucose (top left: 0%; top right: 0.3%; bottom left: 1%; bottom right: 3%). We assembled the four videos with Simulink (Video and Image Processing Blockset).
Results
On the top left of the video (Well 1), there is no α-methyl glucose: cells grew fast in the presence of glucose. After glucose exhaustion, they activate synchronously the araBAD promoter (rise of fluorescence). On the top right of the video (Well 2), the α-methyl glucose has slightly reduced the glycolytic flux and some cells induce the araBAD expression before glucose exhaustion. On the bottom left of the video (Well 3), the glycolytic flux is strongly reduced, the growth is slow and most cells induce araBAD expression before glucose exhaustion. In the last well (bottom right), the α-methyl glucose concentration is so high that cells seem poisoned (very little growth), but all induce araBAD expression before the glucose exhaustion.
Critical parameters to reproduce our results
Given the contradictory results found in the literature about glucose repression, we provide some additional guidelines. Our results are most clearcut for the following experimental conditions:
- using a cyaA- strain with exogenous cAMP (or a crp* strain; and in this case, do not add cAMP).
- using either minimal medium or LB (begin with minimal medium, and switch to LB in case of problem). In our experiments, the transition from pre-culture (LB) to culture is done with a low dilution factor (factor of 10: 180μl of medium + 20μl of pre-culture). This ensures a rapid exhaustion of the carbon sources.
- performing the kinetics in micro-plate in order to easily measure many different concentrations of:
- cAMP
- inducers (if needed)
- Glucose: best results are obtained by comparing 0.03% glucose with 0.3% glucose. These conditions focus on what happen when glucose is exhausted (first concentration), compared to continued growth on glucose (second concentration).
- adding an alternative carbon source to ensure correct transcription/translation capabilities when glucose is exhausted. This carbon source must permit very slow growth (best results with sodium acetate 0.03% w/v).
References
- Ambrose, M., & MacPhee, D. G. 1998. Catabolite repressors are potent antimutagens in Escherichia coli plate incorporation assays: experiments with glucose, glucose-6-phosphate and methyl-alpha-Dglucopyranoside. Mutat Res, 398(1-2), 175–82.
- Baba, T., Ara, T., Hasegawa, M., Takai, Y., Okumura, Y., Baba, M., Datsenko, K. A., Tomita, M., Wanner, B. L., & Mori, H. 2006. Construction of Escherichia coli K-12 in-frame, single-gene knockout mutants: the Keio collection. Mol Syst Biol, 2, 2006 0008. Gm62662/gm/nigms Journal Article Research Support, N.I.H., Extramural Research Support, Non-U.S. Gov’t England.
- Buettner, M. J., Spitz, E., & Rickenberg, H. V. 1973. Cyclic adenosine 3’,5’-monophosphate in Escherichia coli . J Bacteriol, 114(3), 1068–73.
- Crasnier-Mednansky, M. 2008. Is there any role for cAMP-CRP in carbon catabolite repression of the Escherichia coli lac operon? Nat Rev Microbiol, 6(12), 954; author reply 954.
- Datsenko, K. A., & Wanner, B. L. 2000. One-step inactivation of chromosomal genes in Escherichia coli K-12 using PCR products. Proc Natl Acad Sci U S A, 97(12), 6640–5.
- Epstein, W., Rothman-Denes, L. B., & Hesse, J. 1975. Adenosine 3’:5’-cyclic monophosphate as mediator of catabolite repression in Escherichia coli. Proc Natl Acad Sci U S A, 72(6), 2300–4.
- Gorke, B., & Stulke, J. 2008a. Carbon catabolite repression in bacteria: many ways to make the most out of nutrients. Nat Rev Microbiol, 6(8), 613–24.
- Gorke, B., & Stulke, J. 2008b. Is there any role for cAMP-CRP in carbon catabolite repression of the Escherichia coli lac operon? Reply from Gorke and Stulke. Nat Rev Microbiol, 6(12), 954.
- Gosset, G. 2005. Improvement of Escherichia coli production strains by modification of the phosphoenolpyruvate: sugar phosphotransferase system. Microb Cell Fact, 4(1), 14.
- Hantke, K., Winkler, K., & Schultz, J. E. 2011. Escherichia coli exports cAMP via TolC. J Bacteriol. Journal article.
- Hogema, B. M., Arents, J. C., Inada, T., Aiba, H., van Dam, K., & Postma, P. W. 1997. Catabolite repression by glucose 6-phosphate, gluconate and lactose in Escherichia coli . Mol Microbiol, 24(4), 857–67.
- Hogema, B. M., Arents, J. C., Bader, R., Eijkemans, K., Yoshida, H., Takahashi, H., Aiba, H., & Postma, P. W. 1998. Inducer exclusion in Escherichia coli by non-PTS substrates: the role of the PEP to pyruvate ratio in determining the phosphorylation state of enzyme IIAGlc. Mol Microbiol, 30(3), 487–98.
- Inada, T., Kimata, K., & Aiba, H. 1996. Mechanism responsible for glucose-lactose diauxie in Escherichia coli : challenge to the cAMP model. Genes Cells, 1(3), 293–301.
- Khankal, R., Chin, J. W., Ghosh, D., & Cirino, P. C. 2009. Transcriptional effects of CRP* expression in Escherichia coli. J Biol Eng, 3(1), 13.
- Kolb, A., Busby, S., Buc, H., Garges, S., & Adhya, S. 1993. Transcriptional regulation by cAMP and its receptor protein. Annu Rev Biochem, 62, 749–95.
- Kumari, S., Beatty, C. M., Browning, D. F., Busby, S. J., Simel, E. J., Hovel-Miner, G., & Wolfe, A. J. 2000. Regulation of acetyl coenzyme A synthetase in Escherichia coli. J Bacteriol, 182(15), 4173–9.
- Magasanik, B. 1961. Catabolite repression. Cold Spring Harb Symp Quant Biol, 26, 249–56.
- Megerle, J. A., Fritz, G., Gerland, U., Jung, K., & Radler, J. O. 2008. Timing and dynamics of single cell gene expression in the arabinose utilization system. Biophys J, 95(4), 2103–15.
- Monod, J. 1942. Recherches sur la croissance des cultures bacteriennes. 2nd edn. Paris:Hermann.
- Narang, A. 2009a. cAMP does not have an important role in carbon catabolite repression of the Escherichia coli lac operon. Nat Rev Microbiol, 7(3), 250.
- Narang, A. 2009b. Quantitative effect and regulatory function of cyclic adenosine 5’-phosphate in Escherichia coli. J Biosci, 34(3), 445–63.
- Park, Y. H., Lee, B. R., Seok, Y. J., & Peterkofsky, A. 2006. In vitro reconstitution of catabolite repression in Escherichia coli. J Biol Chem, 281(10), 6448–54.
- Peekhaus, N., & Conway, T. 1998. Positive and negative transcriptional regulation of the Escherichia coli gluconate regulon gene gntT by GntR and the cyclic AMP (cAMP)-cAMP receptor protein complex.J Bacteriol, 180(7), 1777–85.
- Perlman, R. L., De Crombrugghe, B., & Pastan, I. 1969. Cyclic AMP regulates catabolite and transient repression in E. coli. Nature, 223(5208), 810–2.
- Postma, P. W., Lengeler, J. W., & Jacobson, G. R. 1993. Phosphoenolpyruvate:carbohydrate phosphotransferase systems of bacteria. Microbiol Rev, 57(3), 543–94.
- Saier, M. H., & Roseman, S. 1972. Inducer exclusion and repression of enzyme synthesis in mutants of Salmonella typhimurium defective in enzyme I of the phosphoenolpyruvate: sugar phosphotransferase system. J Biol Chem, 247(3), 972–5.
- Ullmann, A., & Monod, J. 1968. Cyclic AMP as an antagonist of catabolite repression in Escherichia coli . FEBS Lett, 2(1), 57–60.
- Zaslaver, A., Bren, A., Ronen, M., Itzkovitz, S., Kikoin, I., Shavit, S., Liebermeister, W., Surette, M. G., & Alon, U. 2006. A comprehensive library of fluorescent transcriptional reporters for Escherichia coli . Nat Methods, 3(8), 623–8.