A genome-wide screen for identifying all regulators of a target gene
Author statement (2023)
The identity of the first author is hidden for reasons unrelated to science. The identity of the other authors is hidden because they would probably not want to be associated in any way with the content of this website. The “cheating statement” that one may find on others publications is not added here for the sake of co-authors.
Viafx24
Abstract
We have developed a new screening methodology for identifying all genes that control the expression of a target gene through genetic or metabolic interactions. The screen combines mutant libraries with luciferase reporter constructs. Instead of a static picture of gene expression, this method allows dynamical monitoring in different environmental conditions. Mutants with interesting phenotypes can thus be selected based on multiple criteria, and the expression dynamics of the target gene can be extensively characterized. We apply the method to identify the genes that control the expression of the acs gene of Escherichia coli. We confirm most of the known genetic regulators and identify new regulatory influences, many of which involve metabolic intermediates or metabolic sensing. An analysis of mutants involved in glycolysis and glucose transport demonstrates that the classical model of catabolite repression in E. coli needs to be amended.
Introduction
The adaptation of bacteria to changes in their environment is controlled on the molecular level by a large and complex regulatory network involving genes, mRNAs, proteins and metabolites (Jacob & Monod, 1961). Understanding, and therefore eventually predicting, the dynamics of this regulatory network is a general goal of biology, and in particular of the field of systems biology. The basic ingredient of this type of research is knowing the topology of the underlying regulatory network. An increasing number of such regulatory connections are documented in bioinformatics databases such as Ecocyc , which lists more than 5345 regulatory interactions for E. coli (Keseler et al.,2010).
Different methods are used to identify and characterize these interactions. Evidence for specific interactions can come from in vitro measurement of physical DNA-protein interactions (footprinting, gel retardation assay). Computational tools can predict interactions based on consensus sequence. Transcriptomics (DNA microarrays) is a popular approach to study transcription on a global scale (Brown & Botstein, 1999). Typically, this technique allows detecting the targets of a particular regulator by studying the effect of the deletion of this regulator on the expression of all genes of a genome. ChIP-Chip is another global approach, identifying direct interactions of a specific transcription factor through the detection of chromosome-wide DNA binding (Grainger & Busby, 2008). All these tools aim at identifying regulons, i.e., all the targets of a given regulator (Neidhardt & Savageau, 1996). However, to our knowledge, no global method exists to determine the regulators that control, directly or indirectly, the expression of a particular target gene. We present such a method in this manuscript.
We use the GFP and luciferase reporters to measure promoter activities in living cells (Van Dyk et al., 2001; Hakkila et al., 2002). These constructs provide not only a static picture of expression levels, but allow measuring the dynamics of gene expression with a high temporal resolution (Zaslaver et al., 2006). The luciferase system is particularly useful since it allows measuring gene expression in a colony growing on solid medium. We have developed a technique for efficiently transforming 3571 E. coli single-gene knockout mutants (Baba et al., 2006) with the appropriate reporter plasmid. The screening strategy consists in comparing the luminescence of mutant colonies with the luminescence of a wild-type colony: a significant difference suggests that the deleted gene controls, directly or indirectly, the expression of the target gene.
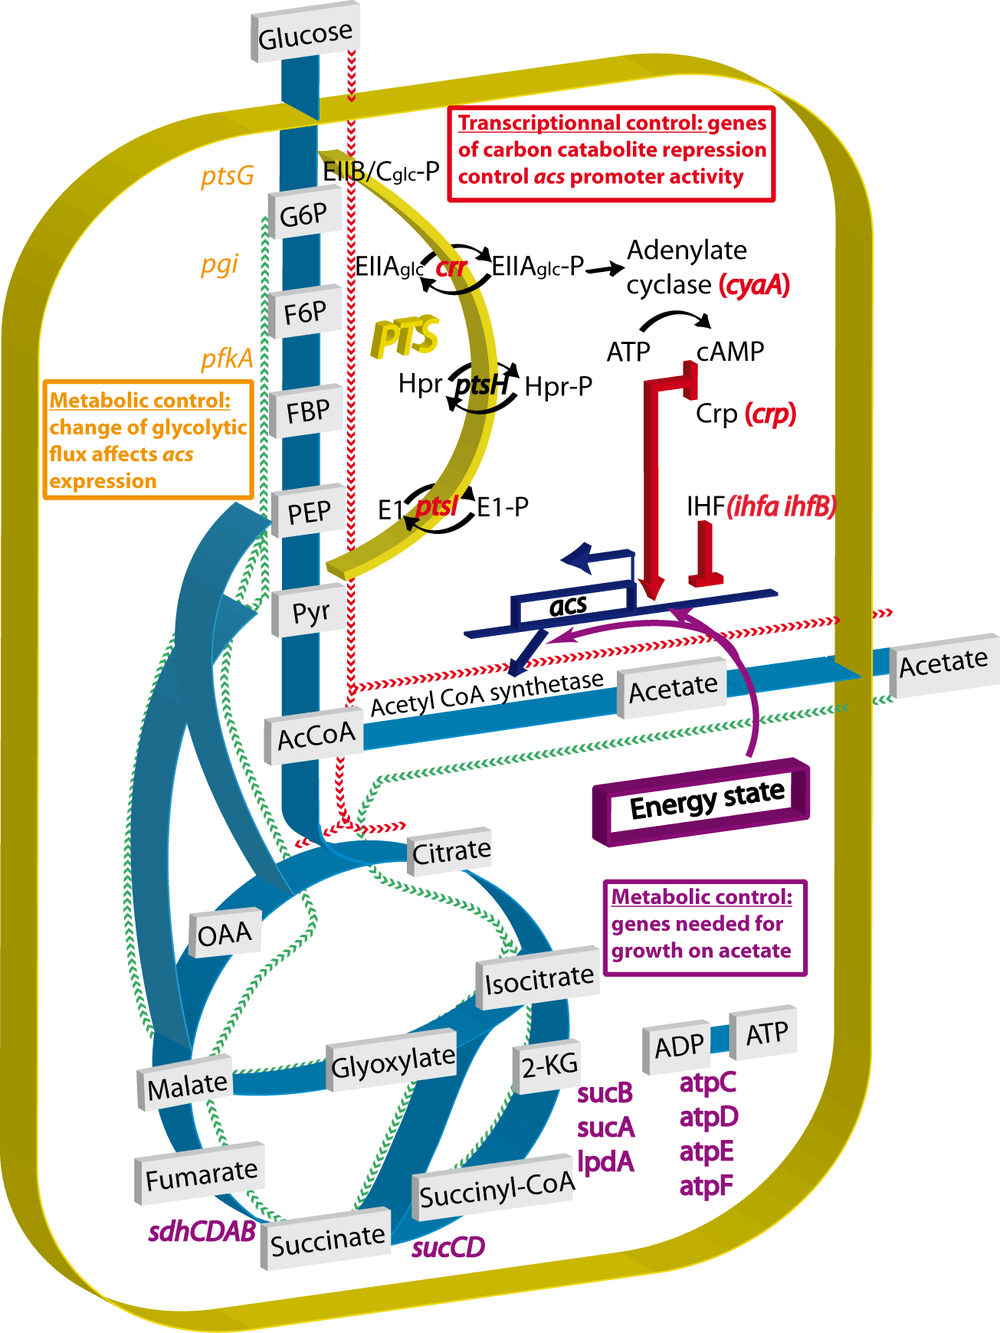
We have applied this method to identify regulators that control the expression of the acs gene, coding for the acetyl coenzyme A synthetase (Kumari et al., 1995). This enzyme converts acetate to acetyl coenzyme A. We have chosen this gene for three reasons. First, this enzyme plays a key role in the "acetate switch": when bacteria grow rapidly on glucose, they excrete acetate which is subsequently used as a carbon source when glucose is exhausted (Wolfe, 2005). Acetyl coenzyme A synthetase is thus at the center of an inversion of metabolic flow from glycolysis to neoglucogenesis. Second, the accumulation of acetate in the culture medium is an important problem in industrial fermentations since this organic acid inhibits cell growth and recombinant protein production. Different approaches are currently developed to reduce acetate accumulation by modifying central metabolic pathways (Gosset, 2005). Lastly, the acs gene was also selected because its complex regulation has been extensively described and thus allows a thorough validation of the method (Kumari et al., 2000; Sclavi et al., 2007; Shin et al., 2009). Briefly, transcription of this gene is repressed by the nucleoproteins Fis and IHF and positively regulated by the CRP-cAMP complex. The latter activation implies the well-studied carbon catabolite repression mechanism where the glucose concentration controls the formation of the CRP-cAMP complex by adjusting the cAMP production via the phosphotransferase system (PTS) (Gorke & Stulke, 2008a). The acs gene is thus at the end of a well-known, complex regulatory cascade, an ideal property for our purpose. Our screen confirms known regulatory mechanisms of acs expression. We also find new candidates for regulatory input that highlight the tight links between metabolism and gene expression.
Results
A screening strategy for identifying the regulators of acs
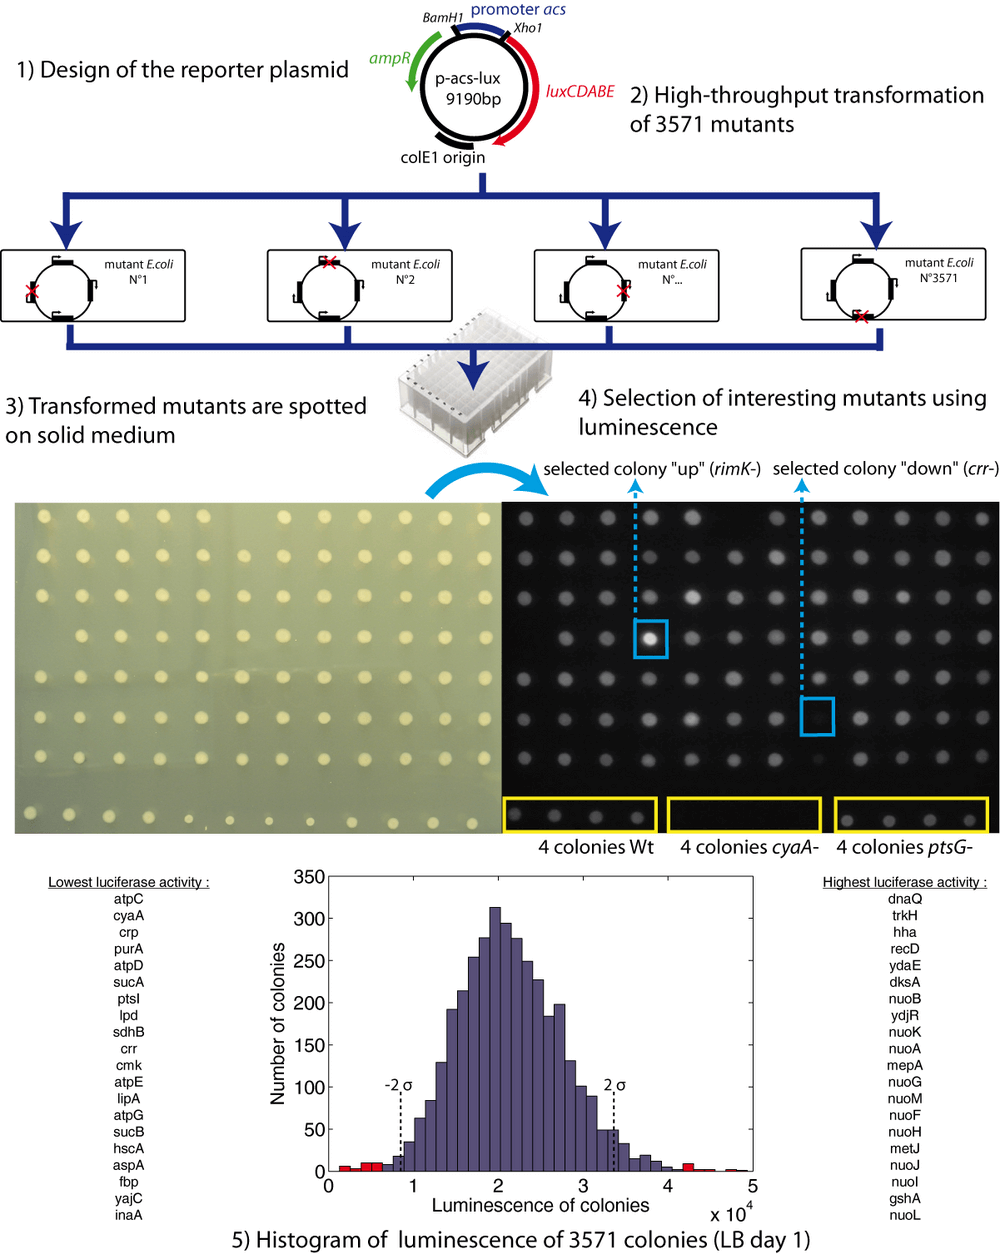
Our screening strategy is outlined in Fig. 1. To measure acs promoter activity we have constructed a reporter plasmid containing a transcriptional fusion of the acs promoter region (394 bp) to the luxCDABE operon. This operon codes for the heterodimeric luciferase protein (luxAB) and the enzymes (luxCDE) necessary for producing the luciferase substrate, a long-chain aldehyde (Meighen, 1991). We have chosen this reporter system because of the highly sensitive luminescence signal, the absence of background, the continuous production of bioluminescence without added substrate, and the possibility to measure luminescence at the colony level. The reporter plasmid was transformed into the 3911 single-gene knockouts of Escherichia coli (Keio collection) using our high-throughput transformation procedure (see Methods). Transformation efficiency was 91%: we have thus obtained 3571 transformants. We spotted the transformed bacteria on solid media and acquired the luminescence images of the colonies that appeared on the plates.
The luminescence of the colonies changes as a function of culture time and growth condition. The powerful features of our screen are that we can monitor the dynamics of gene expression at the colony level (see an example in Supplementary Information 2: Movie) and adapt growth conditions to be most relevant to the gene under investigation. The acs promoter is activated after exhaustion of the preferred carbon source. We therefore measured the luminosity of colonies after 24h and 48h of growth on two different media: rich LB medium and minimal glucose medium. We thus obtained four complete sets of luminosity images of the plates. We quantified the luminosities of the 3571 colonies after 24h of growth on LB plates (Supplementary Data). Fig. 1 shows the corresponding distribution of luminosities. Automatic quantification was not possible for the other growth conditions, but the complete dataset is available in Supplementary Data. From these four batches of luminescence pictures, we have selected 517 (15%) colonies for a detailed kinetic analysis. We also include data about the growth phenotype: among the 3571 transformants, eighty auxotrophic mutants did not grow on minimal medium-agar-glucose (Supplementary Information 4).
The dynamics of acs expression
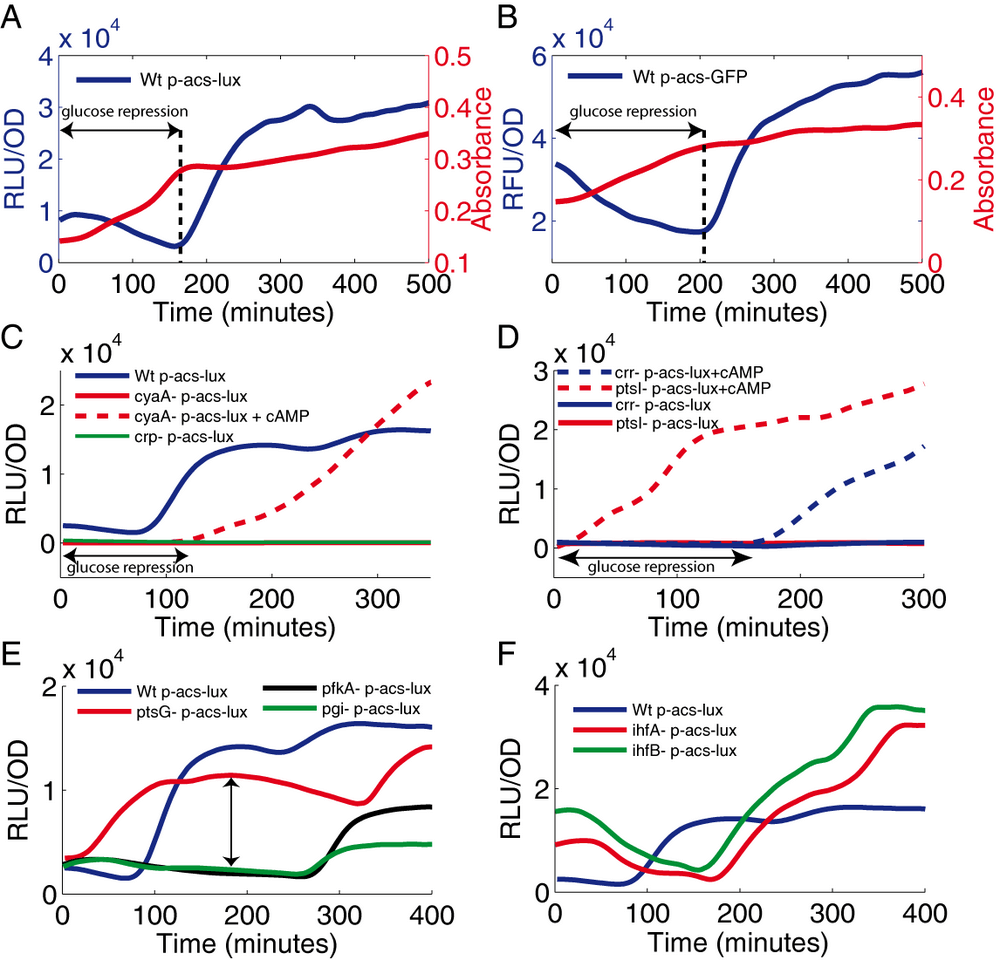
For the 517 pre-selected genes, we measured the dynamics of acs expression in liquid cultures grown in a minimal medium containing glucose and acetate in order to focus on the physiologically important transition between those two carbons sources. The expression patterns were measured in an automated microplate reader and analyzed as previously described (de Jong et al., 2010). Fig. 2A shows the expression profile of acs in the wild-type strain. We observe a sharp increase of acs transcription when glucose is exhausted. This expression pattern is very robust and independent of the reporter system since we observe an identical pattern with the gfp reporter carried on a plasmid with a completely different replication mechanism (Fig. 2B). Note that luminescence is largely preferable for screening because bacteria have a significant auto-fluorescence background, probably due to flavin mononucleotide or riboflavin (Billinton & Knight, 2001).
Known regulators
An important criterion for the validity of a screen is that known interactions should be confirmed. The acs gene is positively regulated by the CRP-cAMP complex (crp gene) and thus by the well-studied carbon catabolite repression mechanism. The influx of glucose through the phosphotransferase system (PTS) controls adenylate cyclase (cyaA gene) activity and thus cAMP production. The PTS is composed of enzymes EI (ptsI gene), HPR (ptsH gene), EIIAglc (crr gene) and EIIB/Cglc (the glucose transporter encoded by the ptsG gene). When glucose is exhausted, the four PTS enzymes are phosphorylated and EIIAglc binds to and activates adenylate cyclase. The cAMP concentration quickly rises and the Crp-cAMP complex activates target promoters such as the acs promoter (Gorke & Stulke, 2008a) (Fig. 5).
The analysis of the genes involved in glucose repression confirms that our screen reliably identifies dramatic, but also subtle changes in the regulation of the target gene. In cyaA and crp strains, there is no transcription of acs at all, demonstrating the strict dependence of acs transcription on the CRP-cAMP complex. The activity of the acs promoter can be restored in the cyaA strain by adding cAMP to the medium but, interestingly, only after glucose exhaustion (Fig. 2C). The crr and ptsI strains show the expected phenotype: a very low acs expression, although significantly higher than in the cyaA and crp strains. cAMP added to the medium clearly restores acs expression in these two strains confirming that these mutants cannot activate adenylate cyclase. As in the cyaA strain, cAMP fails to complement the crr strain while glucose is still present in the growth medium. In contrast, the ptsI strain is directly complemented by cAMP even in presence of glucose (Fig. 2D). This difference of reactivity is not explained by the current model of catabolite repression: adding cAMP to the medium should bypass the glucose repression. Consequently, the cyaA and crr mutants should behave as the ptsI strain, with a direct activation of acs even in presence of glucose. The screen has thus revealed new subtleties of a well characterized control system.
Expression of acs is reported to be negatively regulated by two histone-like proteins Fis and IHF (Browning et al., 2004). The Fis protein is abundant in exponential phase (Ali Azam et al., 1999). Since acs expression is already very low in this growth phase, the observed effect of the fis deletion is rather subtle: the acs expression profile is rather similar to that of the wild-type strain (data not shown). IHF acts mainly in stationary phase (Wolfe, 2005) and we accordingly observe a higher acs expression in late stationary phase (Fig. 2F). The perfect superposition of acs expression profiles observed in the ihfA and ihfB strains (each coding for a subunit of IHF and transcribed from different chromosomal locations) confirms the high accuracy and internal consistency of the method.
Metabolic influences on the reporter system
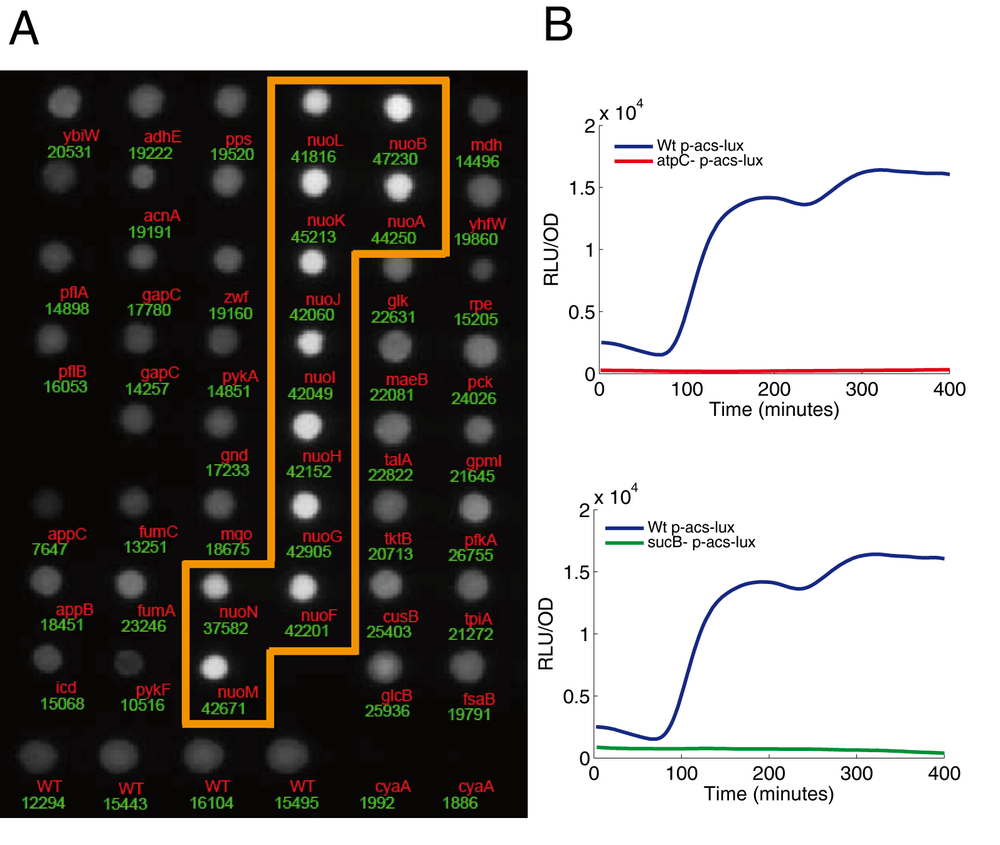
For the purpose of our screen, we want luciferase to report only the changes in gene expression of the target gene. However, the emission of light produced by the colonies does not only depend on luxCDABE transcription, but is also influenced by the metabolic state of the cell, such as concentrations of oxygen, FMNH2, ATP, and NADPH. These metabolites are involved in the enzymatic reactions that lead to light emission (Koga et al., 2005). The nuo operon (13 genes) is a striking example of these metabolic effects on luciferase activity: all corresponding colonies show a higher luminescence on LB plates (Fig. 3A). The nuo operon codes for the NADH dehydrogenase involved in the respiratory chain. In the absence of a functional enzyme, reducing power accumulates (Pruss et al., 1994), thus stimulating the luciferase reaction. This phenotype of the nuo mutants was not observed during the kinetics in liquid medium. In fact, it is the combination of a specific deletion with a specific medium that leads to this metabolic artifact. Consequently, it is not possible to generate a universal list of false positive mutants.
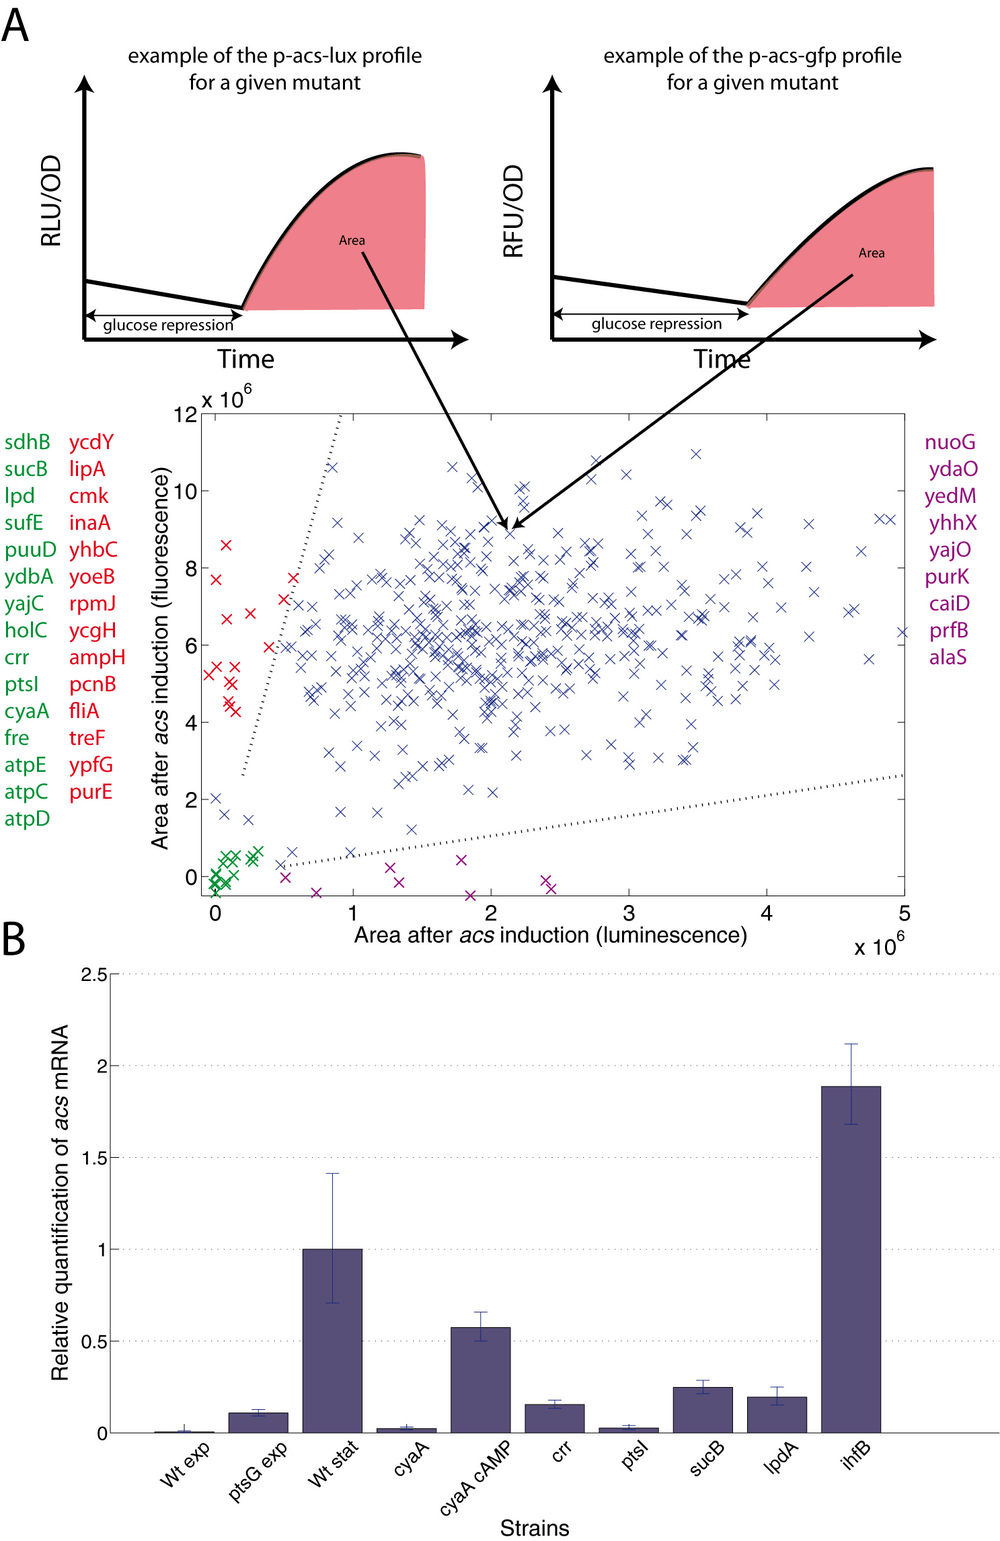
However, a systematic way to detect and eliminate false positives due to the reporter system is to validate the results with a different reporter system that is independent of the metabolic state of the cell. We therefore transformed the 517 selected mutants with the gfp reporter plasmid, also carrying a different origin of replication (thus controlling for mutants that would affect the plasmid copy number). We acquired the expression profile of acs for all selected mutants using the two reporter systems. Fig. 4A shows, for each reporter, the strength of acs induction, computed from the area under the induction curve. Mutants for which acs activation is very different in the two reporter systems (points far off the diagonal) likely represent artifacts of at least one of the reporter systems. We report, for example, 14 false positive mutants (at the left border of the scatterplot), probably affecting light production rather than diminished acs expression.
As a further control for the validity of the reporter assay, we measured transcription for several mutants using quantitative RT-PCR. Mutants in genes coding for the PTS (ptsG, crr, ptsI), cAMP production (cyaA), regulatory proteins (ihfB) and metabolic enzymes (lpdA, sucB) precisely reproduce the effects observed with the reporter genes (Fig. 4B).
Metabolic regulation of acs expression
Even though part of the PTS, the ptsG mutant (which lacks the glucose transporter) behaves very differently from the ptsI and crr mutants: in the ptsG strain, colonies on M9 glucose are much more luminescent than those of the wild-type strain (Supplementary data) and the dynamical analysis shows a higher acs expression level in exponential phase as compared to the wild-type strain (Fig. 2E). According to the classical model of carbon catabolite repression, this phenotype reflects an increased intracellular concentration of cAMP in exponential phase as a consequence of the lower rate of glucose influx (Hogema et al., 1998). The deletion of metabolic enzymes (pgi, pfkA) interrupts glycolysis and forces the metabolic flux to pass though the pentose phosphate pathway. Like the ptsG strain, these mutants grow more slowly on glucose (delayed induction of acs expression), but in this case, acs expression remains completely shut-off in exponential phase (Fig. 2E).
Several of the mutants with the lowest colony luminescence carry deletions of genes involved in the energy supply of the cell (Fig. 1), such as the genes coding for ATP synthetase (atpC, atpD, atpE, atpF ) and the genes coding for enzymes of the TCA cycle: the oxoglutarate dehydrogenase complex (sucA, sucB and lpdA) and, to a lesser extent, succinyl-CoA synthetase (sucCD) and succinate dehydrogenase (sdhCDAB). We found that theses mutants fail to grow on acetate (Supplementary Information 4). In these mutants, the luminescence profile shows an almost total absence of acs expression (Fig. 3B). This result may either represent (i) an artifact of the luminescence reporter system or (ii) a genuine regulation of the acs promoter. Our current data do not allow us to definitively decide between the two possibilities: the nature of the deleted genes (enzymes involved in the energy supply) strongly suggest a mebabolic artifact but the following observations argue for a genuine regulation: the effect is reproduced with the fluorescence reporter and qRT-PCR (Fig. 4) and expression is absent even in rich medium where energy supply should not play a role (Supplementary Data).
Discussion
A new method for identifying the regulators of acs
The classical way to dissect a regulatory network, closely linked to classical approaches in genetics, consists in disrupting a gene of interest and observing the effects on the organism. This approach identifies the downstream targets of the gene of interest. Here, we have developed a method to do the opposite: given a gene of interest, we can identify all factors, genetic and metabolic, that affect the expression of this gene. Our method relies on a high-throughput transformation of a luciferase reporter plasmid into an extensive mutant collection. Even though we have focused on transcriptional regulation, the method can certainly be extended to include translational fusions. We use the Keio-mutant collection, but the scope of the screen could be extended to include, e.g., mutants of non-coding RNAs and intergenic regions that may contain unknown ORFs.
We have chosen luciferase as a reporter because it allows easy screening at the colony level without any significant background signal. Furthermore, the luciferase signal of a colony is highly reproducible, with a standard deviation of about 5% for independent colonies of the same mutant. The enzymatic reaction of luciferase depends on cellular factors such as ATP concentration or redox potential. For a given medium, deletions that seriously affect the concentration of these factors may generate false positives. However, these can be easily excluded by using an alternative reporter system or verification by qRT-PCR.
An important novel feature of our screen is the possibility to directly measure the dynamics of gene expression during the screen or by high-throughput measurements of selected mutants in an automated plate reader. Furthermore, the original screen, as well as these additional analyses, can be carried out in many different environmental and growth conditions.
The regulation of acs transcription
The effects of some interesting mutants identified by the screen are summarized in Fig. 5. We have confirmed known interactions that regulate the transcription of acs and we have discovered interesting new directions to explore. The acs promoter activity is mainly controlled by the CRP-cAMP complex: transcription is completely abolished without CRP or cAMP. We also confirm the involvement of the phospho-transferase system which sets the intracellular concentration of cAMP: the crr and ptsI mutants have a very limited acs expression except when cAMP is added to the medium. Even though part of the same glucose uptake machinery, the ptsG mutant behaves differently from the other PTS mutants: it does not require the addition of exogenous cAMP to activate the acs expression.
We failed to induce acs expression in cyaA or wild-type strains by adding cAMP while glucose was still present in the growth medium. Those results could possibly be explained by another well-known mechanism of glucose repression: inducer exclusion. In this control system, the dephosphorylated form of EIIAglc, the dominant form in the presence of glucose, binds and inhibits different sugar transport systems, thus preventing the entry of the inducing sugar (Roseman & Meadow, 1990) into the cell. However we do not believe that inducer exclusion can account for the glucose repression of the acs transcription in the presence of exogenous cAMP. To date, no inducer of acs expression has been described and acetate can enter the cell by passive diffusion (Gimenez et al., 2003). Furthermore, the central component of inducer exclusion is EIIAglc, encoded by the crr gene. Yet, we still observe glucose repression in a crr mutant in the presence of exogenous cAMP (Fig. 2D). This experiment demonstrates that neither variations of cAMP concentration nor variations of the phosphorylated state of EIIAglc are sufficient to explain the glucose repression that we observe. Consequently, and paradoxically, our results contradict the current two main models of carbon catabolite repression while confirming the involvement of the CRP-cAMP complex and the PTS in the transcription of the acs gene. Despite more than four decades of research, our understanding of the precise mechanism that underlie the glucose effect (and more generally the carbon catabolite repression) is still far from complete and remains the subjects of debate (Inada et al., 1996; Crasnier-Mednansky, 2008; Gorke & Stulke, 2008b; Narang, 2009). We are currently exploring theses paradoxical results in more detail.
Metabolism and gene expression
An important strength of our screen is to uncover connections between metabolism and gene expression. In the case of acs, we find several novel connections between the metabolic state of the cell and the transcription of acs. Although still to be confirmed, it appears that the enzymes involved in the growth on acetate (suc, atp mutants etc…) have a genuine impact on acs expression. Even though such a regulation makes sense biologically, the mechanism of this signal transduction remains to be discovered. Another example involves the glycolytic flux. Reducing the glucose inflow by deleting the glucose transporter (ptsG gene) increases the basal acs expression level during growth on glucose, probably by increasing the intracellular concentration of cAMP. However, the reduction of the glycolytic flux observed during growth of the pgi and pfkA mutants does not lead to an enhancement of acs expression in exponential phase (Fig. 2E). This result shows that neither acs promoter activity nor cAMP concentration are a simple function of the glycolytic flux, which is roughly the same for ptsG, pgi, and pfkA strains, but depends on the exact location where glycolysis is interrupted. We do not yet know the metabolic indicator nor the sensing mechanism that transmits the state of glycolysis to the activation of the acs promoter.
These different observations clearly show a strong connection between the metabolic state of the cell and acs transcription and confirm our prediction that the genetic regulatory network of Escherichia coli is densely connected and that a majority of these connections pass through metabolism (Baldazzi et al., 2010).
Materials and Methods
Strains
The screen uses the Keio collection, comprising 3985 single gene deletions of the E. coli K-12 strain BW25113, called wild-type strain (Baba et al., 2006).
Plasmids
The nrfA-acs intergenic region was amplified by PCR using primers 5'-TCCTCTCGAGAGGGGCTTCA TCCGAAT-3' and 5'-TTTGGGATCCGCTTTTGTTCTCCTTGTAGG-3' and the BW25113 strain as a template. The PCR product, digested with Xho1 and BamHI, was inserted into a luxCDABE plasmid backbone without promoter to give p-acs-lux. A strong ribosome binding site drives efficient expression of the reporter gene. The bla gene (conferring ampicillin resistance) and the acs promoter region of the previous plasmid p-acs-lux were amplified by PCR using primers 5'-TTTGGGATCCGCTTTTGTTCTCCTT GTAGG-3' and 5'-TCTAAAGTGAGCTCGAGTAAACTTGGTCTGACAG-3'. The PCR product, digested with SacI and BamHI, was inserted into pUA66 (Zaslaver et al., 2006) to give p-acs-gfp. The complete sequences of these plasmids are available upon request.
High-throughput transformation
All steps were performed in 96-well plates. 135 plates, 6 days and 4 persons were needed to transform 3571 mutants. All volumes below are indicated for one well. Mutants were inoculated from frozen stock in sterile microplates containing 200 μl per well of Luria-Bertani broth (LB) with kanamycin (50 μg/ml) and placed at 37°C under shaking (200 rpm) overnight. The next day, 4 μl of the pre-culture were added to new plates containing 400 μl of LB with kanamycin (50 μg/ml) and placed at 37°C under shaking for 3 hours. We then transferred 50 μl of these exponentially growing cells to new plates containing 50 μl of ice cold TSS 2X (LB containing 10% PEG, 5% DMSO, and 20-50 mM Mg2+ at a final pH of 6.5) (Chung et al., 1989) and the mixture was kept on ice for 45 min before adding 4 μl of plasmid DNA (50 ng/ml). The plates were left on ice for another 10 minutes before applying a heat shock (90 seconds at 42°C) and returned on ice for an additional 10 minutes of incubation. We finally added 1 ml of LB containing ampicillin (100 μg/ml) and the plates were placed at 37°C under shaking overnight. The following day, we spotted the transformed mutants onto two different petri dishes containing either LB-agar-ampicillin (100 μg/ml) or minimal medium M9-agar-0.3% glucose (p/v)-ampicillin (100 μg/ml). Petri dishes were incubated at 37°C overnight and the luminescence of the colonies was measured the following days using an intensified camera (Photonic Science). The quantification of the luminescence of the 3500 colonies of the condition "LB day 1" was performed semi-automatically by means of a custom-made Matlab scripts (Image processing toolbox). Briefly, we used functions that correct side effects and compute an appropriate threshold on the images allowing the detection of the colonies. Then, we computed the median of luminescence pixels belonging to a specific colony.
Measuring the dynamics of gene expression
The dynamics of gene expression was measured for cells growing for 10 hours in a 96-well microplate. The microplate reader (Perkin Elmer, Fusion alpha FP-HT) allows growth with shaking and temperature control (37°C). We measured the cell density (OD at 600 nm) every 30 min and luminescence or fluorescence (480 nm/520 nm) every 3 minutes. Unless otherwise specified, the wells in the microplate contain 180 μl of minimal medium (M9) supplemented with 0.03% glucose (w/v), 0.03% sodium acetate (w/v), and ampicillin (100 μg/ml). When indicated, we added cyclic AMP (5 mM) at the beginning of the experiment. The wells were inoculated with 20 μl of stationary phase cultures (10x dilution) grown in LB-ampicillin (100 μg/ml). The fluorescence background of the bacterial cells was assessed by measuring the fluorescence of mutant bacteria transformed with a promoterless reporter plasmid.
Quantification of the expression profiles
In order to compare the strength of acs induction at the entry into stationary phase as measured by the luminescence and fluorescence reporter systems, we have calculated the area under the expression profile for four hours following entry into stationary phase (see Figure 4B for a schematic representation). This quantification was carried out using custom-made Matlab scripts that perform the following tasks: (i) Remove outliers from the data. (ii) Determine the time of entry into stationary phase by classifying the expression profiles into different classes and fitting segment splines to the signal (fluorescence or luminescence) and the absorbance measurements. The entry into stationary phase is, e.g., indicated by a break in the absorbance curve. (iii) Correct the fluorescence expression profiles for the autofluorescence of the cells by subtracting corresponding profiles of control strains. No background correction is necessary for luminescence data. (iv) Numerically integrate the expression curve for 240 min, starting at the entry into stationary phase. The expression value was set to zero at the entry into stationary phase and the integral thus gives a measure of the induction strength of the acs promoter in the particular mutant strain. (v) Normalize the integral by the absorbance of the sample at entry into stationary phase.
qRT-PCR
The strains were grown in a microplate containing M9 0.03% glucose and 0.03% acetate (preculture LB). The cells (~108) were harvested either before glucose exhaustion (exponential growth on glucose) or after glucose exhaustion (growth on acetate). Total mRNA was protected using the RNAprotect Bacteria Reagent (Quiagen) and then isolated using the RNeasy mini kit (Quiagen) according to the recommendations of the manufacturer. Potential trace quantities of DNA were removed using the turbo DNAse (Ambion). Samples were protected from RNase using RNaseOut ribonuclease inhibitor (Invitrogen). 1 μg of RNA was reverse transcribed using SuperScript II Reverse Transcriptase (Invitrogen) according to the protocol of the manufacturer. Briefly, a 25 μl reaction mixture was incubated in a T3000 thermocycler (Biometra) for 10 min at 25°C, 50 min at 42°C and 15 min at 70°C. The primers (Eurogentec) used in the present study were as follows: acs: 5' ACAGTTCTGGTGACGGTTCC 3' and 5' ACAGTTCTGGTGACGGTTCC 3'. We have used the rrsD gene as internal control for relative quantification: rrsD: 5' GCTACAATGGCGCATACAAA-3' and 5'-TTCATGGAGTCGAGTTGCAG 3'. Quantitative PCR was performed in a StepOnePlus Real-Time PCR System (Applied Biosystems) using MESA Green qPCR Master Mix (Eurogentec) according to the instructions of the manufacturer. Briefly, 25 μl reactions mixtures were incubated for 10 min at 95°C and 40 PCR cycles (15 s at 95°C and 1 min at 60°C). PCRs were run in triplicate. Raw data were transformed into threshold cycle (Ct) values. The relative strength of acs expression for each mutant, compared to wild-type, was calculated by the comparative Ct Method (ΔΔCt).
Supplementary information
The screen can be performed in different conditions
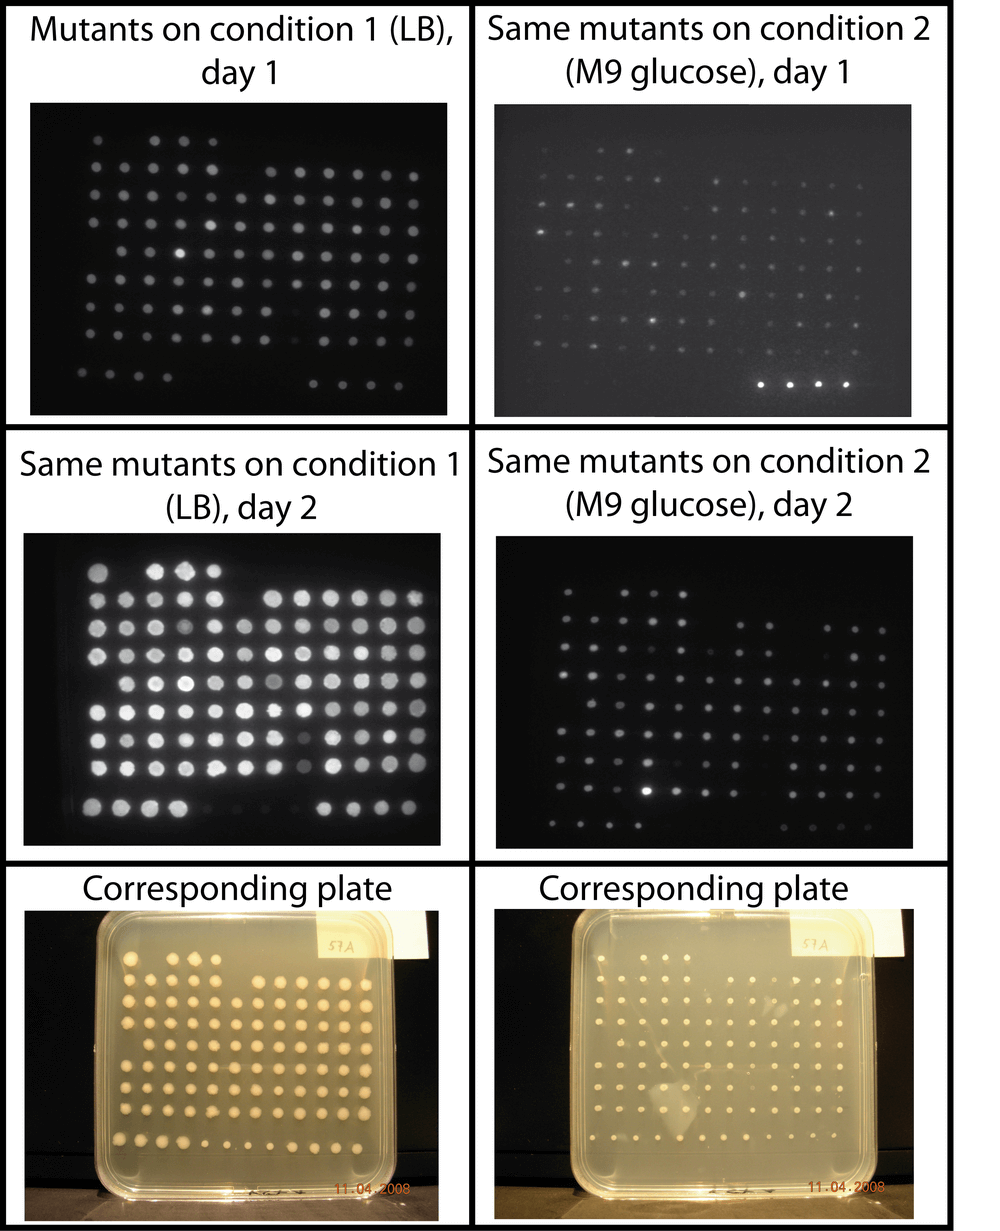
The pattern of luminescence of colonies can significantly change over time and as a function of the growth medium. Our screen allows to easily test different conditions and to perform kinetics at the colony level. Here we show a typical example of a screen where the cells were grown on LB (left column) or M9-glucose minimal medium (right column). The luminescence images were taken after one or two days of incubation. The growth of the colonies is shown in the bottom row. The supplementary data show the luminescence images of colonies grown on LB plates. Luminescence images of M9 plates (and/or colony images) are available upon request.
The screen can be performed dynamically
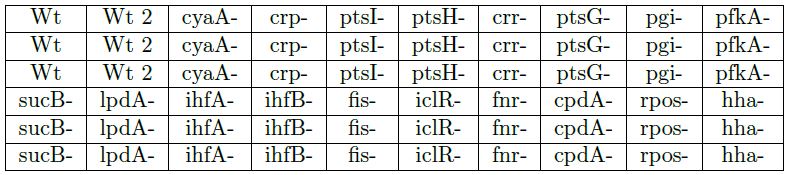
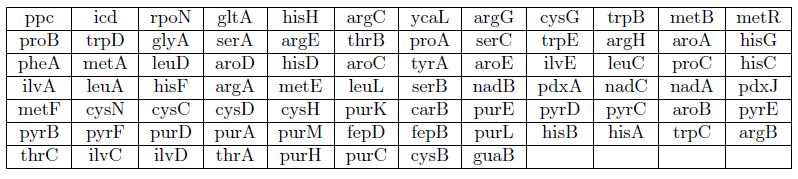
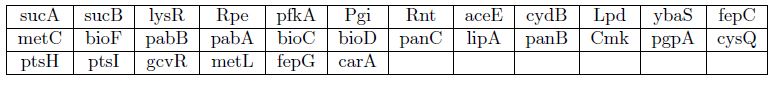
Mutants (see the table) containing the p-acs-lux plasmid were "spotted" on solid M9 medium 0.06% glucose 0.06% acetate 10% LB 1% agar 100 μg/ml ampicillin. We have filmed the development of colonies (luminescence) for 30 hours using an intensified camera.
Results
- The expression profiles of triplicate colonies show identical and highly reproducible kinetics.
- The initial Keio crp strain we used in the screen was incorrectly constructed. A correct copy of this strain shows the same phenotype than the cyaA strain, as expected.
- Wt 2 is a strain with a shorter acs promoter sequence that does not include the acsP1 promoter (maintaining only the acsP2 promoter). Similar expression patterns are obtained, except that the intensity of acs expression is somewhat smaller.
Mutants that do not grow on minimal medium acetate
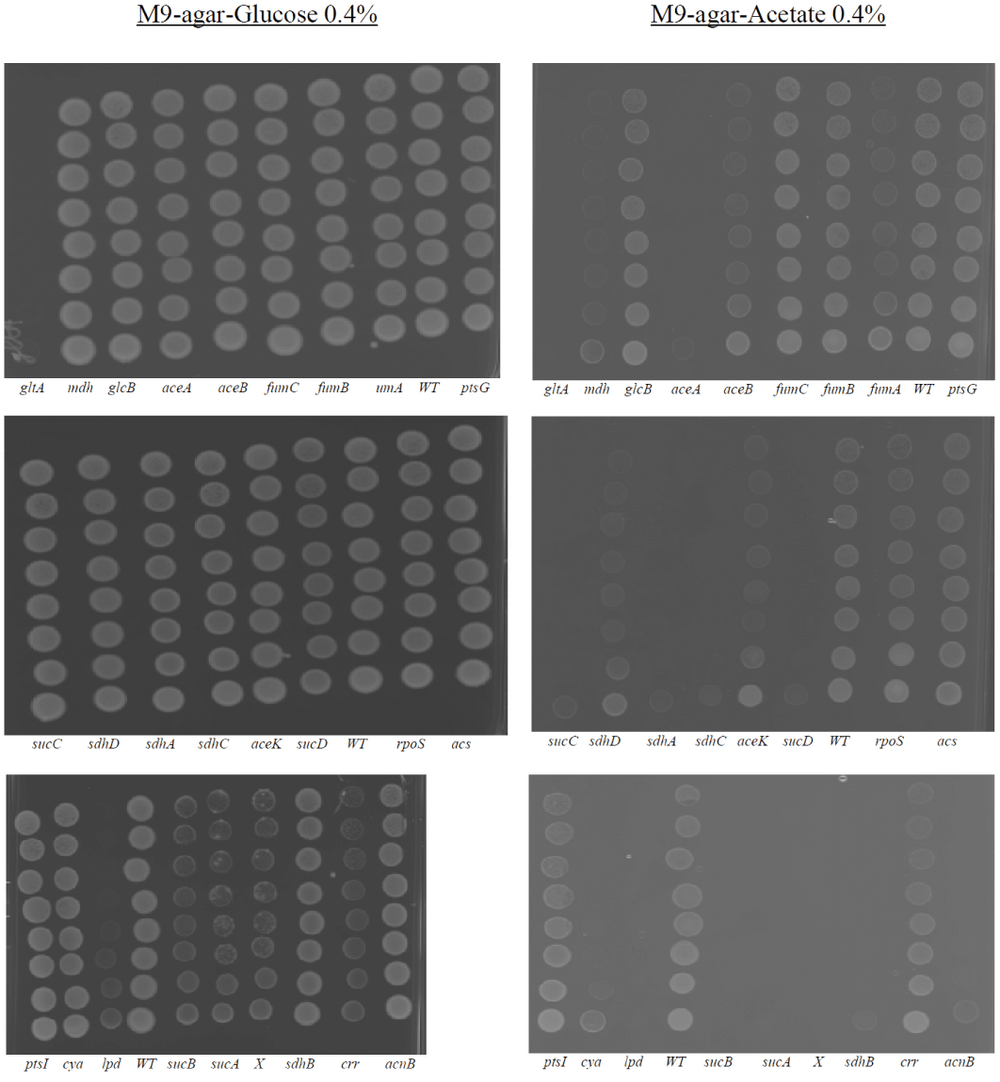
Certain mutants that grow on M9+Agar+glucose (0.4%) do not grow on M9+agar+acetate (0.4%). The y axis (upward) represents serial dilutions (factor 10) of strains pre-cultured in LB medium.
Mutants that do not grow on minimal medium glucose
Mutants that grow on Luria Broth + Agar + ampicillin but do not grow on M9 + agar + 0.3% glucose + ampicillin
Mutants with strong growth defects on M9+agar+0.3% glucose+ampicillin
References
- Ali Azam, T., Iwata, A., Nishimura, A., Ueda, S., & Ishihama, A. 1999. Growth phase-dependent variation in protein composition of the Escherichia coli nucleoid. J Bacteriol, 181(20), 6361–70.
- Baba, T., Ara, T., Hasegawa, M., Takai, Y., Okumura, Y., Baba, M., Datsenko, K. A., Tomita, M., Wanner, B. L., & Mori, H. 2006. Construction of Escherichia coli K-12 in-frame, single-gene knockout mutants: the Keio collection. Mol Syst Biol, 2, 2006 0008.
- Baldazzi, V., Ropers, D., Markowicz, Y., Kahn, D., Geiselmann, J., & de Jong, H. 2010. The carbon assimilation network in Escherichia coli is densely connected and largely sign-determined by directions of metabolic fluxes. PLoS Comput Biol, 6(6), e1000812.
- Billinton, N., & Knight, A. W. 2001. Seeing the wood through the trees: a review of techniques for distinguishing green fluorescent protein from endogenous autofluorescence. Anal Biochem, 291(2), 175–97.
- Brown, P. O., & Botstein, D. 1999. Exploring the new world of the genome with DNA microarrays. Nat Genet, 21(1 Suppl), 33–7.
- Browning, D. F., Beatty, C. M., Sanstad, E. A., Gunn, K. E., Busby, S. J., & Wolfe, A. J. 2004. Modulation of CRP-dependent transcription at the Escherichia coli acsP2 promoter by nucleoprotein complexes: anti-activation by the nucleoid proteins FIS and IHF. Mol Microbiol, 51(1), 241–54.
- Chung, C. T., Niemela, S. L., & Miller, R. H. 1989. One-step preparation of competent Escherichia coli: transformation and storage of bacterial cells in the same solution. Proc Natl Acad Sci U S A, 86(7), 2172–5.
- Crasnier-Mednansky, M. 2008. Is there any role for cAMP-CRP in carbon catabolite repression of the Escherichia coli lac operon? Nat Rev Microbiol, 6(12), 954; author reply 954.
- de Jong, H., Ranquet, C., Ropers, D., Pinel, C., & Geiselmann, J. 2010. Experimental and computational validation of models of fluorescent and luminescent reporter genes in bacteria. BMC Syst Biol, 4, 55.
- Gimenez, R., Nunez, M. F., Badia, J., Aguilar, J., & Baldoma, L. 2003. The gene yjcG, cotranscribed with the gene acs, encodes an acetate permease in Escherichia coli. J Bacteriol, 185(21), 6448–55.
- Gorke, B., & Stulke, J. 2008a. Carbon catabolite repression in bacteria: many ways to make the most out of nutrients. Nat Rev Microbiol, 6(8), 613–24.
- Gorke, B., & Stulke, J. 2008b. Is there any role for cAMP-CRP in carbon catabolite repression of the Escherichia coli lac operon? Reply from Gorke and Stulke. Nat Rev Microbiol, 6(12), 954.
- Gosset, G. 2005. Improvement of Escherichia coli production strains by modification of the phosphoenolpyruvate:
- sugar phosphotransferase system. Microb Cell Fact, 4(1), 14.
- Grainger, D. C., & Busby, S. J. 2008. Methods for studying global patterns of DNA binding by bacterial transcription factors and RNA polymerase. Biochem Soc Trans, 36(Pt 4), 754–7.
- Hakkila, K., Maksimow, M., Karp, M., & Virta, M. 2002. Reporter genes lucFF, luxCDABE, gfp, and dsred have different characteristics in whole-cell bacterial sensors. Anal Biochem, 301(2), 235–42.
- Hogema, B. M., Arents, J. C., Bader, R., Eijkemans, K., Inada, T., Aiba, H., & Postma, P. W. 1998. Inducer exclusion by glucose 6-phosphate in Escherichia coli. Mol Microbiol, 28(4), 755–65.
- Inada, T., Kimata, K., & Aiba, H. 1996. Mechanism responsible for glucose-lactose diauxie in Escherichia coli: challenge to the cAMP model. Genes Cells, 1(3), 293–301.
- Jacob, F., & Monod, J. 1961. Genetic regulatory mechanisms in the synthesis of proteins. J Mol Biol, 3, 318–56.
- Keseler, I. M., Collado-Vides, J., Santos-Zavaleta, A., Peralta-Gil, M., Gama-Castro, S., Muniz-Rascado, L., Bonavides-Martinez, C., Paley, S., Krummenacker, M., Altman, T., Kaipa, P., Spaulding, A., Pacheco, J., Latendresse, M., Fulcher, C., Sarker, M., Shearer, A. G., Mackie, A., Paulsen, I., Gunsalus, R. P., & Karp, P. D. 2010. EcoCyc: a comprehensive database of Escherichia coli biology. Nucleic Acids Res, 39(Database issue), D583–90.
- Koga, K., Harada, T., Shimizu, H., & Tanaka, K. 2005. Bacterial luciferase activity and the intracellular redox pool in Escherichia coli. Mol Genet Genomics, 274(2), 180–8.
- Kumari, S., Tishel, R., Eisenbach, M., & Wolfe, A. J. 1995. Cloning, characterization, and functional expression of acs, the gene which encodes acetyl coenzyme A synthetase in Escherichia coli. J Bacteriol, 177(10), 2878–86.
- Kumari, S., Beatty, C. M., Browning, D. F., Busby, S. J., Simel, E. J., Hovel-Miner, G., & Wolfe, A. J. 2000. Regulation of acetyl coenzyme A synthetase in Escherichia coli. J Bacteriol, 182(15), 4173–9.
- Meighen, E. A. 1991. Molecular biology of bacterial bioluminescence. Microbiol Rev, 55(1), 123–42.
- Narang, A. 2009. cAMP does not have an important role in carbon catabolite repression of the Escherichia coli lac operon. Nat Rev Microbiol, 7(3), 250.
- Neidhardt, F.C., & Savageau, M. A. 1996. Regulation beyond the operon. Pages 1310–1324 of: Escherichia coli and Salmonella: Cellular and Molecular Biology, vol. 1. Washington, DC: ASM Press.
- Pruss, B. M., Nelms, J. M., Park, C., &Wolfe, A. J. 1994. Mutations in NADH:ubiquinone oxidoreductase of Escherichia coli affect growth on mixed amino acids. J Bacteriol, 176(8), 2143–50.
- Roseman, S., & Meadow, N. D. 1990. Signal transduction by the bacterial phosphotransferase system. Diauxie and the crr gene (J. Monod revisited). J Biol Chem, 265(6), 2993–6.
- Sclavi, B., Beatty, C. M., Thach, D. S., Fredericks, C. E., Buckle, M., & Wolfe, A. J. 2007. The multiple roles of CRP at the complex acs promoter depend on activation region 2 and IHF. Mol Microbiol, 65(2), 425–40.
- Shin, S., Chang, D. E., & Pan, J. G. 2009. Acetate consumption activity directly determines the level of acetate accumulation during Escherichia coli W3110 growth. J Microbiol Biotechnol, 19(10), 1127–34.
- Van Dyk, T. K., Wei, Y., Hanafey, M. K., Dolan, M., Reeve, M. J., Rafalski, J. A., Rothman-Denes, L. B., & LaRossa, R. A. 2001. A genomic approach to gene fusion technology. Proc Natl Acad Sci U S A, 98(5), 2555–60.
- Wolfe, A. J. 2005. The acetate switch. Microbiol Mol Biol Rev, 69(1), 12–50.
- Zaslaver, A., Bren, A., Ronen, M., Itzkovitz, S., Kikoin, I., Shavit, S., Liebermeister, W., Surette, M. G., & Alon, U. 2006. A comprehensive library of fluorescent transcriptional reporters for Escherichia coli. Nat Methods, 3(8), 623–8.