Using luciferase activity to infer the metabolic state of Escherichia coli
Author cheating statement (2023)
This publication has never been published in the peer-review system. It is published here, on this website, more than 10 years after the writing of the manuscript. The identity of the author (or the authors) is hidden for reasons unrelated to science. In this publication, one will find description of experiments, figures, data… I have to warn the reader that I mainly cheat for all figures, data proposed here… I mean that I have performed a lot of arbitrations that would, without any doubt, be considered by most scientists as falsification of data/figure/experiment and thus as cheating. However, I always did it in order to maximise the probability that the reader succeeds to reproduce the results and, thus, thinks internally: “what this Man has claimed is actually the truth”. I repeat that the anonymisation of the first author of this publication is unrelated to this confession of cheating.
For this particular publication, my “cheating statement” needs to be a bit more accurate. Thus, I suggest to curious readers, to go at the end of this manuscript, just before the references, to take a look at the paragraph named “False acetate concentration measurements”.
Viafx24
Abstract
The terrestrial luciferase of Photorhabdus luminescens, encoded by the luxCDABE operon, is a classic reporter system used for monitoring promoter activity. In order to emit photons, the luciferase requires an energy source provided by a functioning central metabolism. When the cell lacks energy, there is an Abrupt Decline of Luciferase Activity (ADLA). In this manuscript we show that this dependence of luciferase activity on the availability of cellular energy sources can be used to infer metabolic states of the cell in vivo and in real time. The system can also be used to measure more specific parameters such as the relative activity of a specific enzyme, the speed of acetate consumption, the overflow metabolism or the level of catabolite repression. Combined with a library of mutants, the measurement of luciferase activity may also help to increase the accuracy of our metabolic maps or provided a tool for similar applications.
Introduction
Characterization of the response of Escherichia coli cells to genetic and environmental perturbations is often performed ex situ using fast sampling techniques with or without a quenching step. Analyses of the transcriptome, proteome and/or metabolome are carried out a posteriori, after cell disruption, using DNA microarray or mass spectrometry (Ishii et al., 2007). Those powerful, high-throughput technologies provide large amounts of data at the genome scale, but they do not give access to the behavior of the organism in real time.
Conversely, GFP and luciferase reporters allow measuring promoter activities in living cells (Hakkila et al., 2002; Van Dyk et al., 2001) with a high temporal resolution (Zaslaver et al., 2006). Contrary to GFP, which needs an external input (excitation light) to produce the output signal, bacterial luciferase emits photons without external dependencies. The ease and sensitivity of light detection, associated with the absence of background, has led to numerous applications using luciferase, such as enzymatic assays, biosensors and in vivo imaging (Waidmann et al., 2011).
The terrestrial luciferase of Photorhabdus luminescens is part of a five genes operon (luxCDABE). The genes of the operon code for luciferase as well as the enzymes necessary for producing the substrates of the light generating reaction. The key substrate, a long-chain aldehyde, is produced within the cell by the reduction of fatty acid catalyzed by the gene products of luxC, luxD, and luxE. The hetero-dimeric luciferase, encoded by luxA and luxB genes, oxidizes this substrate and FMNH2 in presence of oxygen, to emit a photon at 490 nm (Meighen, 1991). The reaction is as follow:

The production of FMNH2 requires an electron transport system, driven by the central reactions of carbon and energy metabolism (Sunya et al., 2011). Consequently, light production does not only reflect the quantity of luciferase, but also the concentration of the metabolites participating in the light-generating reaction, and thus the activity of the metabolic reactions that produce these metabolites. For example, it has been shown that an Abrupt Decline of Luciferase Activity (ADLA) occurs upon entry in stationary phase of Escherichia coli cells due to a drop of the intracellular redox pool (Koga et al., 2005).
In this study, we present several ways in which ADLA, and, more generally the variation of luciferase activity, can be exploited as a measure of the metabolic state of the cell. The variation of luciferase activity, combined with the appropriate genetic tools (mutants), allows to assess specific metabolic fluxes and thus indirectly monitor the activity of the corresponding enzymes.
Results
Detection and characterization of the abrupt decline of luciferase activity
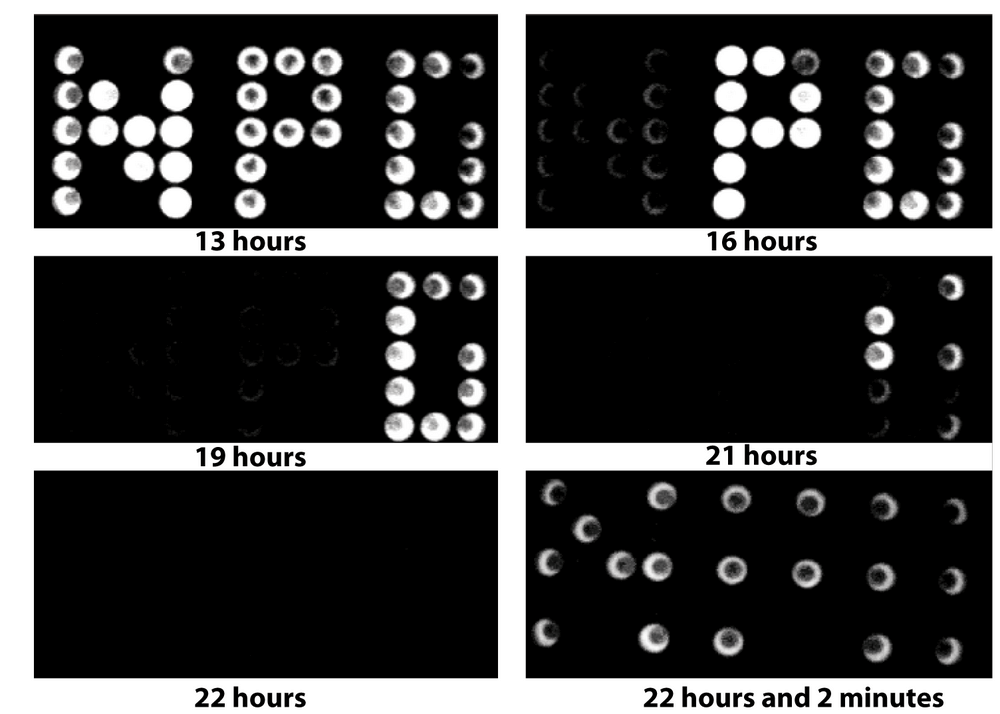
We first wanted to show that ADLA can be used as a measure for the availability of a carbon or energy source. In order to verify this basic premise, we grew Escherichia coli expressing the luxCDABE operon from Photorhabdus luminescens on a minimal medium with glucose as a carbon and energy source. We observed light production by the luciferase during the growth phase and an abrupt extinction of light emission when the energy source was exhausted. To illustrate the phenomenon, we created a bacterial billboard by growing the bacteria in a 96-well microplate with different amounts of glucose in the different wells (Figure 1 and supplementary information: movie). The concentration of glucose increases from left to right in the microplate. As soon as energy production stops (the duration of growth is a function of the glucose concentration), luciferase activity drops sharply. The luciferase enzymes are still present after the cessation of light production, since adding glucose after the ADLA allows immediate recovery of the original luminescence signal.
Measuring the metabolic state of cells
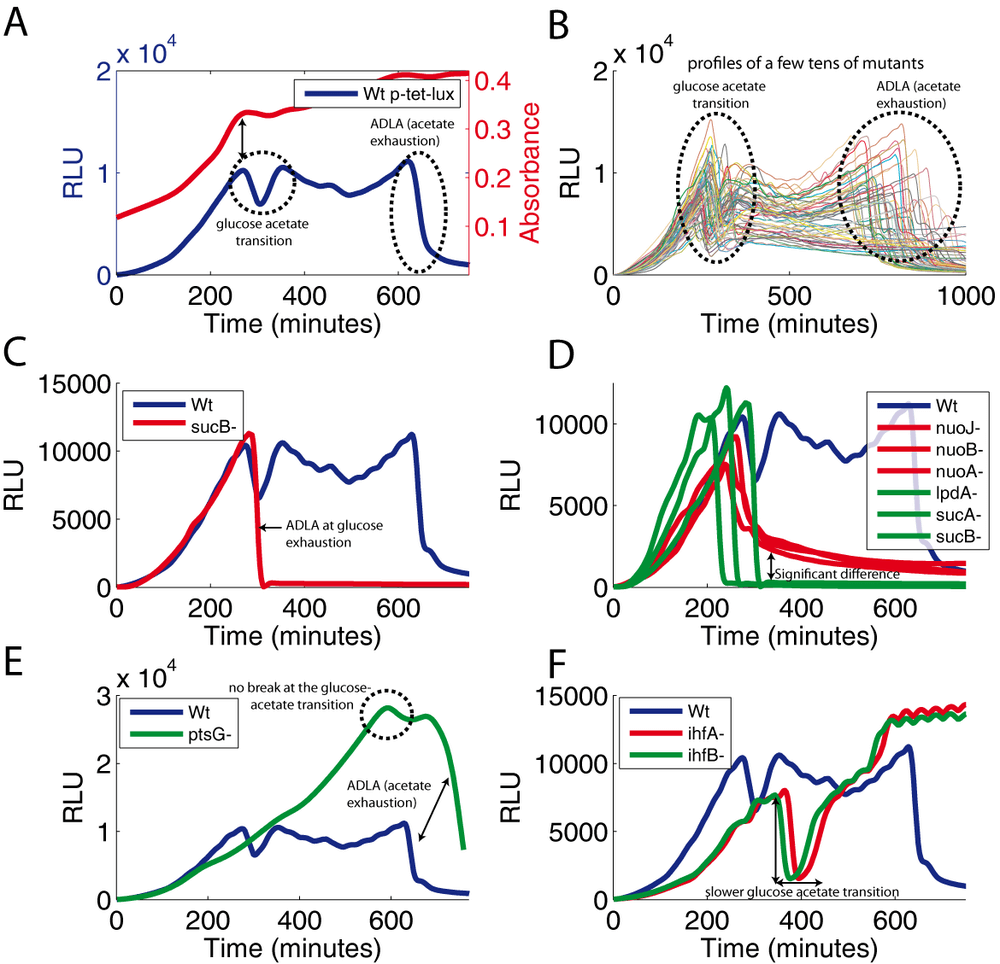
Not surprisingly, this experiments shows that light emission is completely shut off when cellular energy is exhausted. Could we obtain a more graded response and use the intensity of light emission as a measure of the intracellular energy level ? In order to separate signals controlling light production, i.e., the regulation of luxCDABE transcription, and the energy requirement of luciferase activity, we use the synthetic tet promoter to drive the expression of the luxCDABE operon. The activity of this promoter is repressed by the TetR repressor, and repression is lifted by adding anhydrotetracycline (aTc) to the medium. We grew a wild-type strain containing this construction on a minimal medium containing glucose, acetate and the inducer (aTc). The temperature was maintained at 37°C and we measured the absorbance and luminescence of the culture grown directly in a microplate reader. The presence of the inducer from the beginning of the kinetics directly triggers the transcription of luxCDABE (Figure 2A). When glucose is exhausted (break on the red curve), there is a sharp decrease immediately followed by a rapid recovery of the luminescence signal. This event marks the transient fall of energy during the glucose-acetate transition. When acetate is exhausted, there is no remaining energy source in the medium and we observe an abrupt decline of luciferase activity (ADLA). Thus, measuring luciferase activity driven by a constitutive promoter during the growth of the bacterial culture can be used to detect, in real time, small and large variations of energy supply.
Since the luminescence profile gives an indication of energy availability, we can use this signal to assess the effect of different mutants on the energy metabolism of E. coli. We therefore transformed hundreds of single-gene knock-out mutants (Baba et al., 2006) with the biosensor plasmid and measured their corresponding luminescence profile in the same conditions as in Figure 2A. Most of the mutants have a luminescence profile similar to that of the wild-type strain (Figure 2B).
However, a subset of the mutants (sucB, sucA, lpdA, atpC, atpD) fails to maintain luciferase activity after glucose exhaustion (Figure 2C; exemplified by the sucB mutant). In fact, the oxoglutarate dehydrogenase complex and ATP synthetase are needed for growth on acetate. In these mutants, the impossibility to use acetate as an energy source after glucose exhaustion directly leads to the abrupt decline of luciferase activity. For mutants that are impaired in using acetate as an energy source, we observe intermediate phenotypes. The nuo operon shown in figure 2D is an example. We interpret the different levels of light production by these mutants as a measure of metabolic flux. The small differences of the growth phenotype would be impossible to detect and a full blown metabolic analysis would be very time consuming and costly. Consequently, we propose to use the capability to maintain luciferase activity as a very sensitive measure of the metabolic state of the cell.
Certain mutants show interesting phenotypes, but are more difficult to interpret. The ptsG mutant lacking the main glucose transporter takes much more time to consume glucose, as expected. However, we did not observe the transient decrease of the luminescence signal when glucose is exhausted (Figure 2E; locate the circle). The glucose-acetate transition may occur without transient drop of energy or the cells may consume glucose and acetate at the same time during growth. On the contrary, the transient drop of light emission at the glucose-acetate transition is much more pronounced in the ihfA and ihfB mutants, compared to the wild-type strain (Figure 2F). This phenotype may reflect a slower glucose-acetate transition in the IHF deficient strain. IHF is a transcriptional activator of the aceBAK operon, which codes for enzymes of the glyoxylate by-pass (Resnik et al., 1996), the crucial pathway for gluconeogenesis and thus for acetate utilization. The absence of IHF may slow the establishment of this pathway, an event reported by the almost complete, transient loss of luciferase activity after glucose exhaustion.
Tuning and measuring acetyl CoA synthetase activity in vivo
The transient decrease in luciferase activity after glucose exhaustion probably represents the time needed by the cell to switch from glucose metabolism to the utilization of acetate, the only remaining carbon source. The key enzyme for acetate utilization is acetyl-CoA synthetase, coded by the acs gene. This enzyme converts acetate to acetyl coenzyme A, which is the first enzymatic reaction allowing acetate utilization. By controlling the expression of acs, we should therefore be able to control the luciferase activity of a "metabolic biosensor".
acs transcription is activated by the Crp-cAMP complex after glucose exhaustion and there is no promoter activity at all in a mutant lacking adenylate cyclase, the enzyme producing cAMP coded by the cyaA gene. However, this lack of cAMP can be complemented by adding exogenous cAMP to the growth medium. Different concentrations of added cAMP activate the acs promoter to different extents. If our hypothesis is correct, this should lead to different levels of acetyl-CoA synthetase leading to different levels of energy in the cell, which could be detected by the appropriate biosensor. Figure 3A shows the expression of acs in a cyaA strain, detected by a fusion of luciferase to the acs promoter. The transcriptional response is clearly dependent on the concentration of cAMP in the growth medium. The promoter is shut-off during growth on glucose. The p-acs-lux fusion thus reports essentially acs transcription and not energy availability of the cell.
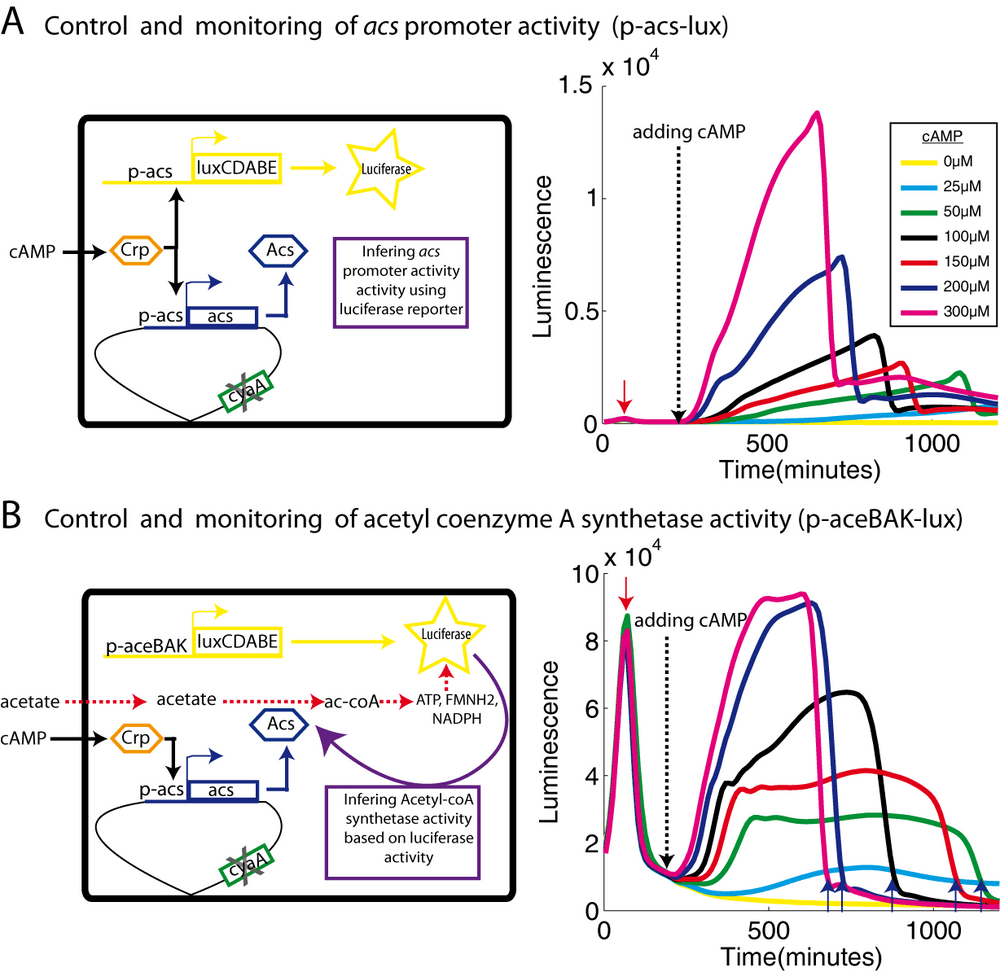
In order to measure luciferase activity as a function of energy supply, we used the aceBAK promoter, again fused to the luciferase operon (p-aceBAK-lux). The very strong aceBAK promoter leads to a very high luciferase concentration. At those levels of luciferase activity, variation of light emission mainly reports changes in the energy supply rather than the regulation of the aceBAK promoter. Consequently, in our experiment, the aceBAK biosensor mainly reports the acetyl-coenzyme A synthetase activity, i.e., the rate of acetate metabolism.
We grew the cyaA cells as before on minimal medium in the presence of glucose and acetate, but without exogenous cAMP. The aceBAK promoter is highly transcribed during growth on glucose (Figure 3B, times before the red arrow). Luciferase activity drops sharply when glucose is exhausted (red arrow). In this state, the cyaA mutants no longer grow because acetyl-CoA synthetase is not produced. We kept the cells in this state for about an hour, then added different concentrations of cAMP to the medium. This addition triggers the activation of acs transcription (Figure 3A). The arrival of acetyl coenzyme A synthetase enzymes triggers utilization of acetate as a carbon source and thus allows the recovery of luciferase activity of the aceBAK biosensor (Figure 3B). The luciferase activity reflects energy production and thus the rate of acetate consumption which is function of the concentration of acetyl coenzyme A synthetase. Indeed, the luciferase activity of the aceBAK biosensor during growth on acetate (Figure 3B) correlates well with the activity of the acs promoter (Figure 3A). Furthermore, faster acetate utilization (at higher cAMP concentrations) also leads to an earlier onset of ADLA (Figure 3B, blue arrows), because the fixed amount of acetate in the medium is consumed more rapidly.
To conclude, in this experiment, we monitored, in vivo and in real time, the relative level of acetyl coenzyme A synthetase and thus the rate of acetate consumption by using the information provided by the recovery of luciferase activity. We checked our interpretation by using a cyaA acs double mutant that fails to recover luciferase activity despite the presence of exogenous cAMP, as expected (see supplementary information).
Correlation between ADLA and the end of glucose repression
We have shown in a previous work that carbon catabolite repression (CCR) senses the metabolic state of the cell, probably energy availability or glycolytic flux. Using our biosensor that responds to energy availability, we can assess the connection between this parameter and the expresssion of CCR-controlled promoters.
To monitor CCR, we use the araBAD promoter. This promoter is activated both by the AraC-arabinose complex and by the Crp-cAMP complex. Since we wanted to study only CCR, we added the inducer (arabinose) to all media in these experiments. As expected, in these conditions, we observe that the expression of araBAD is strongly induced when glucose is exhausted.
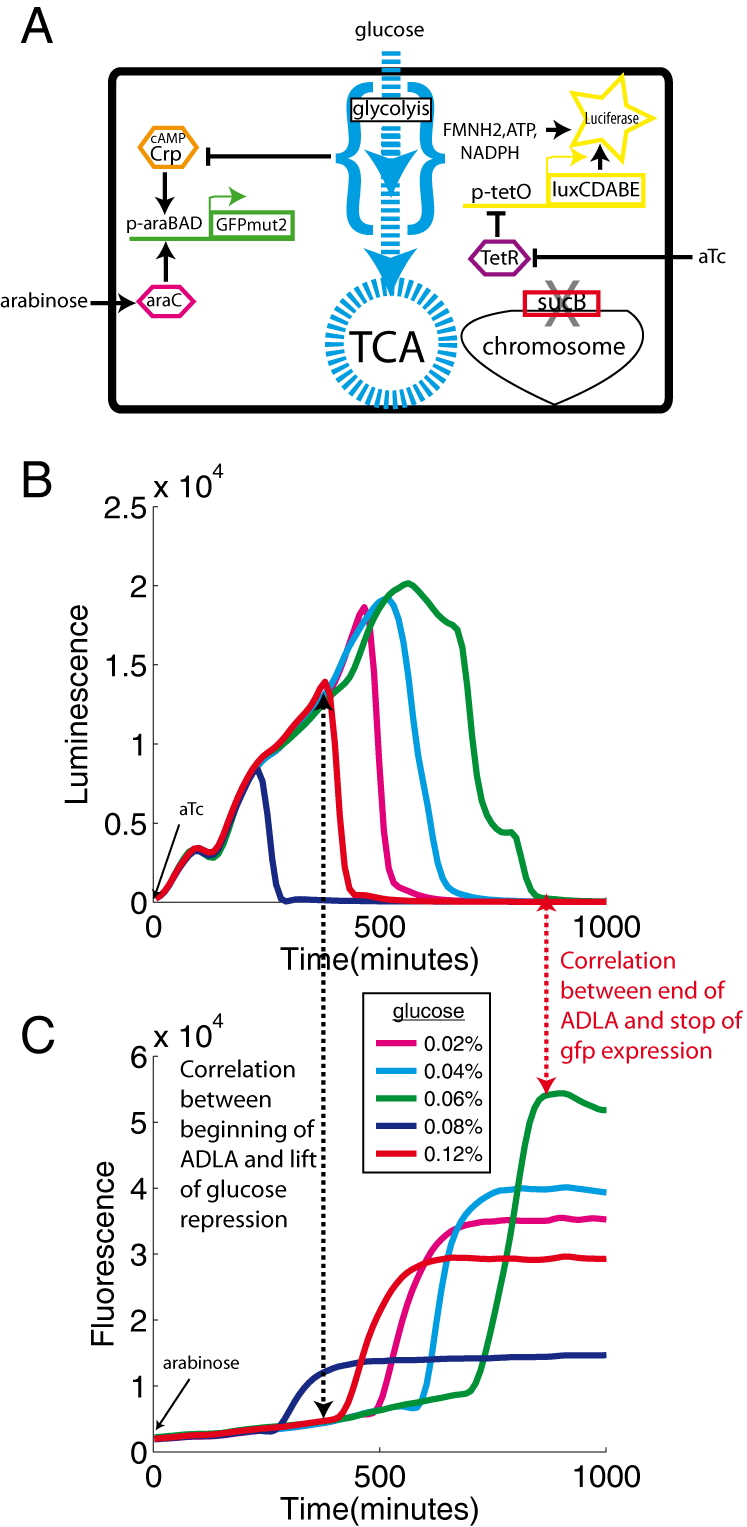
To assess energy availability and CCR in the same cell, we transformed a sucB mutant with two biosensors (Figure 4A): the previously described p-tet-lux plasmid that reports the energy level of the cells (luminescence), and the p-araBAD-gfp plasmid, that measures the activity of the araBAD promoter (fluorescence). We grew the strain in a minimal medium containing glucose and the inducers (arabinose and aTc). As expected for a sucB mutant, we observe an abrupt decline of luciferase activity once glucose exhaustion (Figure 4B). Simultaneously with ADLA (luminescence), we observe the induction of the araBAD promoter (fluorescence) (Figure 4B vs 4C; black dashed arrow). The drop of luciferase activity indicates the decrease in energy availability and this event seems to trigger the transcription of cAMP-CRP controlled promoters. We confirmed this result with another Crp-cAMP dependent promoter (acs promoter; data not shown). When all energy sources are used up, no residual luciferase activity remains (Figure 4BC, red dashed arrow) and the transcription of gfp also stops. All cellular functions seem to be shut down at this point.
Quantifying the overflow metabolism
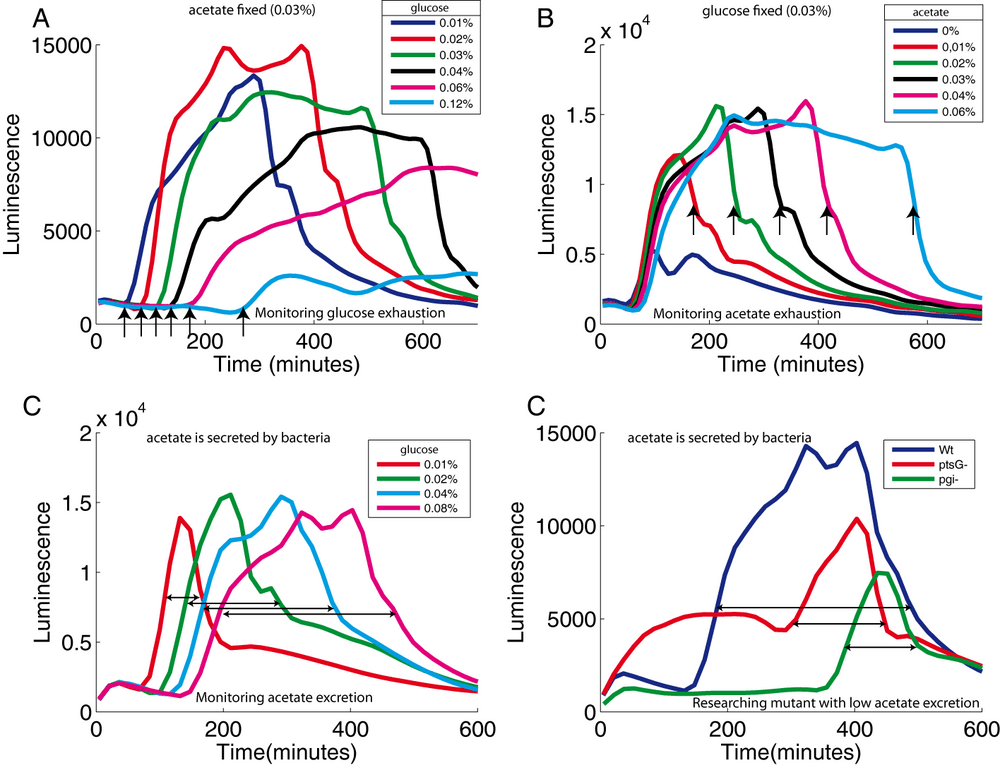
In addition to measuring intracellular physiological states, we can use the reporter system also to assess the media composition. As described above, acs expression is strongly induced when glucose is exhausted. The p-acs-lux plasmid can therefore be used to detect glucose exhaustion. By varying the concentration of glucose, in the presence of a fixed acetate concentration, we observe a strong increase of luminescence correlated with the glucose concentration (Figure 5A). Conversely, by fixing the glucose concentration and varying the acetate concentration, we can control the time of the abrupt decline of luciferase activity that marks acetate exhaustion (Figure 5B). Combining these two phenotypes, we can use the p-acs-lux plasmid to detect both glucose and acetate exhaustion in real-time.
The transition from growth on glucose to growth on acetate is a natural phenomenon for Escherichia coli. When these bacteria grow rapidly on glucose, they excrete acetate in the culture medium (Wolfe, 2005). This phenomenon have been called "overflow metabolism". Once glucose is exhausted, bacteria import the secreted acetate and used it as a carbon source. Using our reporter plasmid, we were able to quantify the overflow metabolism. We grew a wild type strain carrying the p-acs-lux plasmid in varying concentrations of glucose, but without adding acetate to the medium. With increasing glucose concentration, we observe a proportional increase of the delay between acs induction (reporting glucose exhaustion) and ADLA (reporting acetate exhaustion) (Figure 5C). We believe that this delay is indicative of the amount of acetate secreted due to overflow metabolism.
An easy way to test this hypothesis consists in testing mutants known to limit overflow metabolism and acetate secretion due to low glycolytic flux (Lin et al., 2005). Compared to a wild-type strain, both the ptsG mutant (that lacks the main glucose transporter) and the pgi mutant (that interrupts glycolysis) show a delayed acs induction. This is expected for strains that consume glucose more slowly (Figure 5D). However, for the same glucose concentration, the delay between acs induction and the ADLA is much shorter in these two strains compared to the wild type strain. Our p-acs-lux biosensor is therefore a simple tool for estimating acetate secretion and overflow metabolism.
Discussion
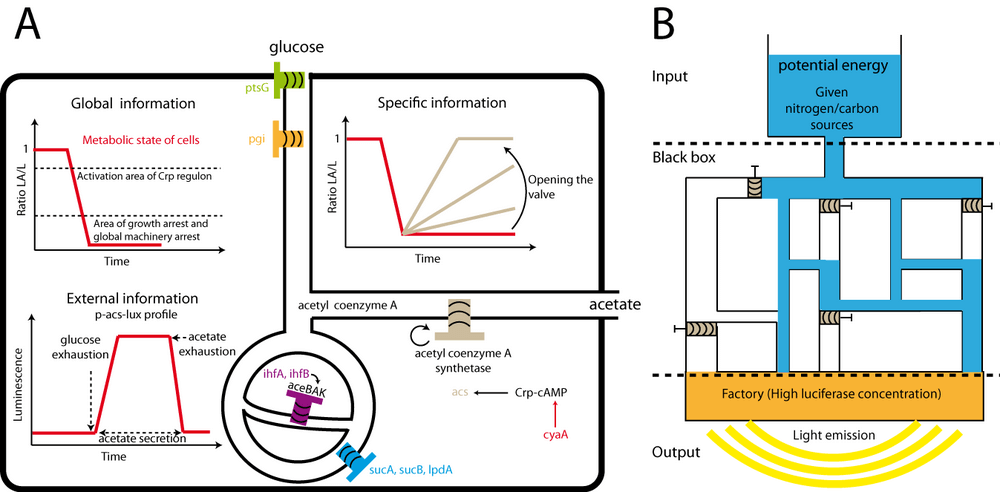
In this study, we have shown that bacterial luciferase can be used, both as a reporter of promoter activity and of the metabolic state of the cell. When there is excess energy, the reporter system measures transcription, when cellular energy is limiting, the luciferase activity is determined by the metabolic state of the cell and the reporter system measures metabolic activity. The schematic of figure 6A and the following paragraphs summarize the main results.
Global information
The main parameter to consider in order to measure the global metabolic activity of the cell is the ratio luciferase-activity / luciferase (ratio LA/L), especially when luciferase concentration (L) is high. When the activity of metabolism, or cellular energy, drops, this ratio drops. The accuracy of light detection, and its large dynamical range, allow detecting small variations of energy supply.
The ratio LA/L also allows to estimate the functioning of the global expression machinery of the cell in a rather obvious way: when no energy is available at all, the luciferase activity, and therefore the ratio LA/L, drops to zero. In synthetic biology, regulatory networks are sometimes considered independently of the activity of metabolism. Yet, variations of the metabolic activity have a profound effect on gene expression and the regulation of gene expression. The LA/L ratio may provide a useful parameter to assess the capacity of the cell to perform the function of a designed, or natural, genetic regulatory network. Last, at intermediate levels of the LA/L ratio, we can assess the activity of certain Crp-cAMP dependent promoters.
Specific information
Depending on the experimental condition, the LA/L can also be used to obtain more specific information. In this study, we have used this parameter to quantify the activity of acetyl coenzyme A synthetase (and the corresponding flux of acetate utilization). By controlling the expression of acetyl coenzyme synthetase, our aceBAK biosensor correctly indicated the rate of acetate utilization and thus the degree of energy availability of the cell. This method of detection/relative quantification of enzyme activity is not limited to acetyl coenzyme A synthetase. The activity of any enzyme could be quantified by setting the conditions such that this enzyme constitutes the bottleneck for luciferase activity. For instance, controlling lacZ expression in cells growing on a minimal medium with lactose as the only carbon source will limit the rate of metabolism and a luciferase-based biosensor of metabolic activity would thus indirectly measure β-galactosidase activity.
Information about media composition
In this study, we also present a biosensor, p-acs-lux, that responds to glucose exhaustion (via a transcriptional activation) and on acetate exhaustion (via the drop of metabolic activity). Taken together, those two signals can be used to measure acetate secretion during overflow metabolism. This biosensor could thus be useful, for example, in a screening procedure that aims at identifying mutants with low acetate secretion. The accumulation of acetate in the culture medium is an important problem in industrial fermentations since this organic acid inhibits cell growth and recombinant protein production. Different approaches are currently developed to reduce acetate accumulation by modifying central metabolic pathways (Gosset, 2005).
Redrawing metabolic flux
By combining the complete mutant library of E. coli with the current knowledge of metabolism, the ratio LA/L may help to re-draw, with a high resolution, the map of metabolic flux for a given medium. Indeed luciferase activity is particularly well-suited for detecting small metabolic leaks. We propose an analogy with a Dam (Figure 6B). Potential energy (water) is stocked as carbon or nitrogen sources. The water flow passes through a complex circuit with valves placed on each channel. At the downstream end, a factory (high luciferase concentration) transforms the potential energy in light, provided sufficient flux arrives at the factory. To reconstruct an unknown circuit of channels, the experimenter would close certain valves (knock out mutant) or enlarges other (over expression) and analyses the effect on light production. A serious limitation of this approach is the fact that luciferase activity is affected by "global energy availability" : ATP, NADPH, NADH, FMNH2. A mutant affecting specifically the concentration of one of those metabolites without affecting the other could generate artifacts: the luminescence signal may drop even though the cell still has a lot of energy. However, among the dozens of mutants involved in energy production that we have tested, we did not find a single one (including nuo, atp, fre, suc mutants) growing normally without being able to maintain luciferase activity. In this sense, luciferase activity seems to be a robust, global measure of energy availability in the cell.
Conclusion
In this study we have shown that reporter systems based on bacterial luciferase may be used for inferring different parameters about the functioning of the cell. The ease and sensitivity of light detection, associated with its small cost, make our method/tool easy to implement/to use. The biosensors can potentially be used in many applications in biotechnology, system and synthetic biology.
Materials and Methods
Strains
The mutant strains come from the Keio collection (Baba et al., 2006). The wild type strain (E. coli K-12 strain BW25113) has a well-defined pedigree and has not been subjected to mutagens (Datsenko & Wanner, 2000). We removed the kanamycin cassette of the sucB mutant using the flp recombinase to allow antibiotics compatibility. The cyaA- acs- double mutant was constructed by removing the kanamycin resistance cassette of the cyaA- strain. Then, we transduced (P1 phage transduction) the kanamycin resistance cassette of the acs- strain in the cyaA- strain. High-throughput transformation of hundreds of mutants was performed by using a previously described protocol (results not yet published).
Plasmids
We have used the p-acs-lux and p-tet-lux plasmids whose construction has already been described (results not yet published). The p-araBAD-gfp comes from the Uri Alon collection (Zaslaver et al., 2006). The metA-aceB intergenic region was amplified by PCR using primers 5'-GCTGCTCGAGTCTTCTGTGATAGTCGATC-3' (xho1 site) and 5'-GTTCGAATTCCGTGCAGCTCCTCGTCAT-3' (EcoRI site) using BW25113 strain as template. The PCR product, digested with Xho1 and EcoRI, was inserted into a luxCDABE plasmid backbone without promoter to make p-aceB-lux.
Measurement of light emission
Images of the figure 1 have been obtained by filming a microplate placed in a heated chamber using a sensitive CCD camera (photonic science). Histogram equalization has been performed to remove the luminescence background.
Dynamic measures of luminescence and/or fluorescence were performed by growing cells during several hours within a microplate reader (fusion alpha FP-HT). This micro plate reader allows growth with shaking and temperature control (37°C). It measure cell density (OD at 600nm), luminescence and/or fluorescence (485nm/520nm) at a high temporal resolution (~5 minutes). Wells of the microplate contain 180μl of medium and 20μl (dilution 10) of cells in stationary phase. Cells in stationary phase (Figure 1, 2, 5) come directly from a LB pre-culture. Cells in stationary phase (Figure 3, 4) come from a LB pre-culture which have been centrifuged and the pellet have been re-suspended in a equivalent volume of clean M9 medium. The main parameters that differ between experiments are the strains, the concentrations of inducers (cAMP, arabinose and aTc) and the concentrations of the carbon sources (glucose and acetate). They are indicated in the legend of the figures.
Supplementary information
Video of ADLA
Video from which were extracted the images of Figure 1. This bacterial billboard is obtained by filming for 25 hours the luminescence emitted by a 96-well microplate. The results obtained from this visualization of the cellular energy metabolism are somewhat more complete and complex than the description given in the results section. This video shows two different phenomena:
- carbon catabolite repression (CCR).
- Abrupt Decline of Luciferase Activity (ADLA).
The letters N, P, G were formed by appropriately grouping the wells of a 96-microplate. The wells forming the letters contained a minimal medium supplemented with glucose and acetate (0.03% w/v). The wells also contained the wild-type E. coli strain transformed with a reporter plasmid carrying the luciferase operon (luxCDABE) under control of the acs promoter. The glucose concentration increases from left to right on the microplate (0.01% w/v to 0.06% w/v). Cells further to the right therefore grow for a longer time before exhausting glucose. When glucose is exhausted, the global regulator CRP turns on the transcription of the luxCDABE operon and letters switch on, one after the others. This effect is called catabolite repression.
At this stage, bacteria use acetate as a carbon source. When this nutrient is also exhausted, there is no remaining carbon source in the medium and the letters of the "bacterial billboard" switch off, one after the other. This effect is called Abrupt Decline of Luciferase Activity (ADLA).
Control of luciferase activity with a cyaA- acs- double mutant
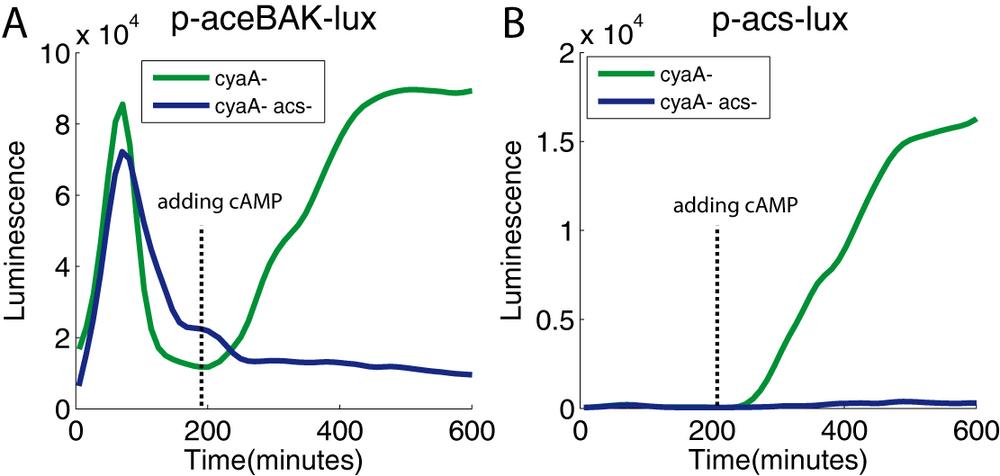
In the experiment of the Figure 3B (see the section Tuning and measuring acetyl CoA synthetase activity in vivo), we have shown that adding exogenous cAMP in the growth medium leads to a recovery of luciferase activity. This phenomenon is probably due to the transcription of the acs gene, known to be induced by the Crp-cAMP complex. To definitively prove the essential role of this gene, we repeated this experiment in a cyaA- acs- background. In the supplementary figure 7A, we show that adding cAMP triggers the recovery of luciferase activity in the cyaA- mutant, but not in the cyaA- acs- double mutant, as expected. Moreover, in the cyaA- acs- double mutant, despite cAMP being added to the medium, we failed to induce acs expression (Figure 7B). This result strongly suggests that the production of acetyl-coA synthetase after the induction of the acs transcription is critical for allowing the consumption of acetate. This alternative carbon source then provides the energy source needed to continue transcription and/or translation of its own promoter. This positive metabolic feedback loop provides a physiologically reasonable regulation in adaptation to the environment: the production of the enzyme needed for utilizing acetate as a carbon source is stimulated by the action of this same enzyme.
[2023: False acetate concentration measurements]
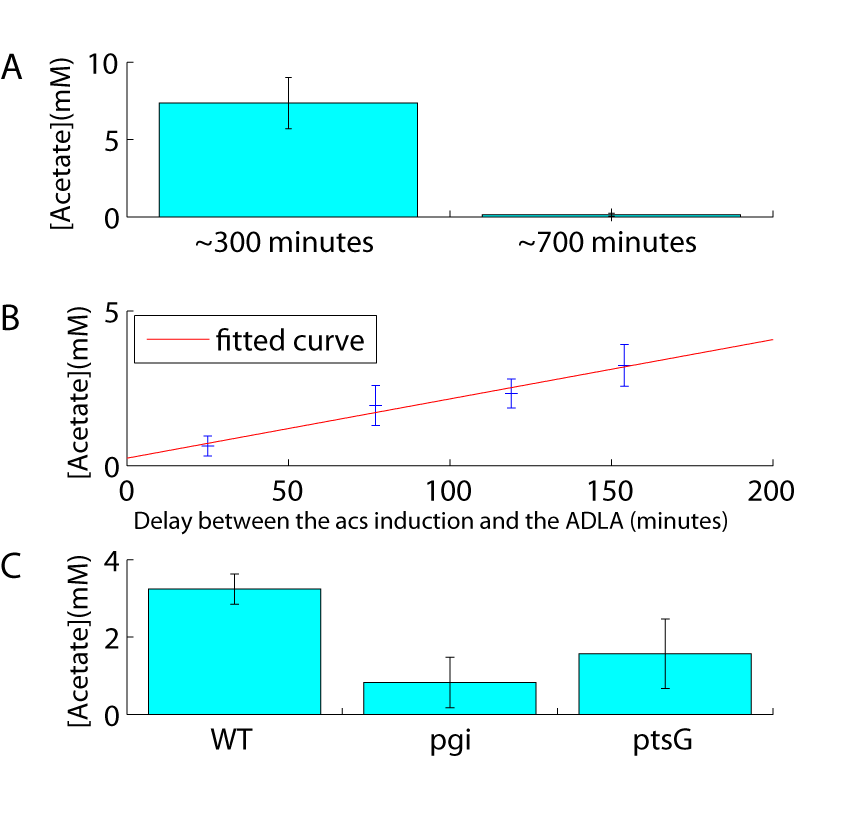
10 years ago, I have tried to publish this article in PLOS one. I knew that there was a strong probability that reviewers ask for acetate concentration measurement to confirm my claim that the method proposed here may also allow to infer acetate excreted in the medium. To prevent this, I had added a lot of “conditional” in the manuscript meaning that it was an hypothesis rather than a demonstration and that needs further works to be confirmed. Of course, reviewers ask for those acetate concentration measurements. For one thousand reasons that I don’t have the time to described here and that I will simply synthetized by the sentence “life is like this”, I could not perform this experiment. Thus, I decided to generate an entirely false figure of acetate measurement based on invented (and seeming believable) data. Creating this false figure takes me a lot of time and energy and probably more time than actually simply performing the experiment. But, as I said, this latter option did not exist. This kind of cheating is different from the ones I confess usually: “cheating in order to maximize reproducibility of the results”. Here, the invented data may have taken away the reader from the “truth” and he may have failed to reproduce the data, loosing his time due to my lie/lying. The reason why I have accepted to go until here was the following. Among the four publications proposed in my PhD thesis, this one was, to my point of view, the most important. It was not an important scientific (“nobler”) discovery, it was an important technical (“less noble”) discovery. But with potentially strong implications in the field “microbial cell factory” (among others) and thus, indirectly, in the most important field for a biologist: medicine.
I put the figure here as a wink to the past. Hopefully, making some readers smile 😊. In 2023 and -- let’s imagine -- placed in the same circumstances 10 years later, would I accept “a small lying” for “a nobler cause”? Or would I “stick” with “truth and real science” accepting the non-publication of this work that could have played a role in the medicine field? This may be considered as an important question but sorry: right now, I don’t have the time to answer it.
To finish, note that the manuscript that I have submitted to PLOS one 10 years ago was a bit better and clearer than this one because I had worked on it to improve it (and added all the “conditionals” about acetate excretion). I had also "proof-readed" it by a professional (native English speaker). I can’t provide this “better” version to readers but, from memory, difference was not that big and the main and most important message does not change.
References
- Baba, T., Ara, T., Hasegawa, M., Takai, Y., Okumura, Y., Baba, M., Datsenko, K. A., Tomita, M., Wanner, B. L., & Mori, H. 2006. Construction of Escherichia coli K-12 in-frame, single-gene knockout mutants: the Keio collection. Mol Syst Biol, 2, 2006 0008.
- Datsenko, K. A., & Wanner, B. L. 2000. One-step inactivation of chromosomal genes in Escherichia coli K-12 using PCR products. Proc Natl Acad Sci U S A, 97(12), 6640–5.
- Gosset, G. 2005. Improvement of Escherichia coli production strains by modification of the phosphoenolpyruvate: sugar phosphotransferase system. Microb Cell Fact, 4(1), 14.
- Hakkila, K., Maksimow, M., Karp, M., & Virta, M. 2002. Reporter genes lucFF, luxCDABE, gfp, and dsred have different characteristics in whole-cell bacterial sensors. Anal Biochem, 301(2), 235–42.
- Ishii, N., Nakahigashi, K., Baba, T., Robert, M., Soga, T., Kanai, A., Hirasawa, T., Naba, M., Hirai, K., Hoque, A., Ho, P. Y., Kakazu, Y., Sugawara, K., Igarashi, S., Harada, S., Masuda, T., Sugiyama, N., Togashi, T., Hasegawa, M., Takai, Y., Yugi, K., Arakawa, K., Iwata, N., Toya, Y., Nakayama, Y., Nishioka, T., Shimizu, K., Mori, H., & Tomita, M. 2007. Multiple High-Throughput Analyses Monitor the Response of E. coli to Perturbations. Science.
- Koga, K., Harada, T., Shimizu, H., & Tanaka, K. 2005. Bacterial luciferase activity and the intracellular redox pool in Escherichia coli. Mol Genet Genomics, 274(2), 180–8.
- Lin, H., Bennett, G. N., & San, K. Y. 2005. Metabolic engineering of aerobic succinate production systems in Escherichia coli to improve process productivity and achieve the maximum theoretical succinate yield. Metab Eng, 7(2), 116–27.
- Meighen, E. A. 1991. Molecular biology of bacterial bioluminescence. Microbiol Rev, 55(1), 123–42. Resnik, E., Pan, B., Ramani, N., Freundlich, M., & LaPorte, D. C. 1996. Integration host factor amplifies the induction of the aceBAK operon of Escherichia coli by relieving IclR repression. J Bacteriol, 178(9), 2715–7.
- Sunya, S., Gorret, N., Delvigne, F., Uribelarrea, J. L., & Molina-Jouve, C. 2011. Real-time monitoring of metabolic shift and transcriptional induction of yciG::luxCDABE E. coli reporter strain to a glucose pulse of different concentrations. J Biotechnol.
- Van Dyk, T. K., Wei, Y., Hanafey, M. K., Dolan, M., Reeve, M. J., Rafalski, J. A., Rothman-Denes, L. B., & LaRossa, R. A. 2001. A genomic approach to gene fusion technology. Proc Natl Acad Sci U S A, 98(5), 2555–60.
- Waidmann, M. S., Bleichrodt, F. S., Laslo, T., & Riedel, C. U. 2011. Bacterial luciferase reporters: The Swiss army knife of molecular biology. Bioeng Bugs, 2(1), 8–16.
- Wolfe, A. J. 2005. The acetate switch. Microbiol Mol Biol Rev, 69(1), 12–50.
- Zaslaver, A., Bren, A., Ronen, M., Itzkovitz, S., Kikoin, I., Shavit, S., Liebermeister, W., Surette, M. G., & Alon, U. 2006. A comprehensive library of fluorescent transcriptional reporters for Escherichia coli. Nat Methods, 3(8), 623–8.